# 📊 Plotext+ - Modern Terminal Plotting
[](https://badge.fury.io/py/plotext_plus)
[](https://pepy.tech/project/plotext_plus)
[](https://github.com/ccmitchellusa/plotext_plus/issues)
[](https://github.com/ccmitchellusa/plotext_plus/pulls)
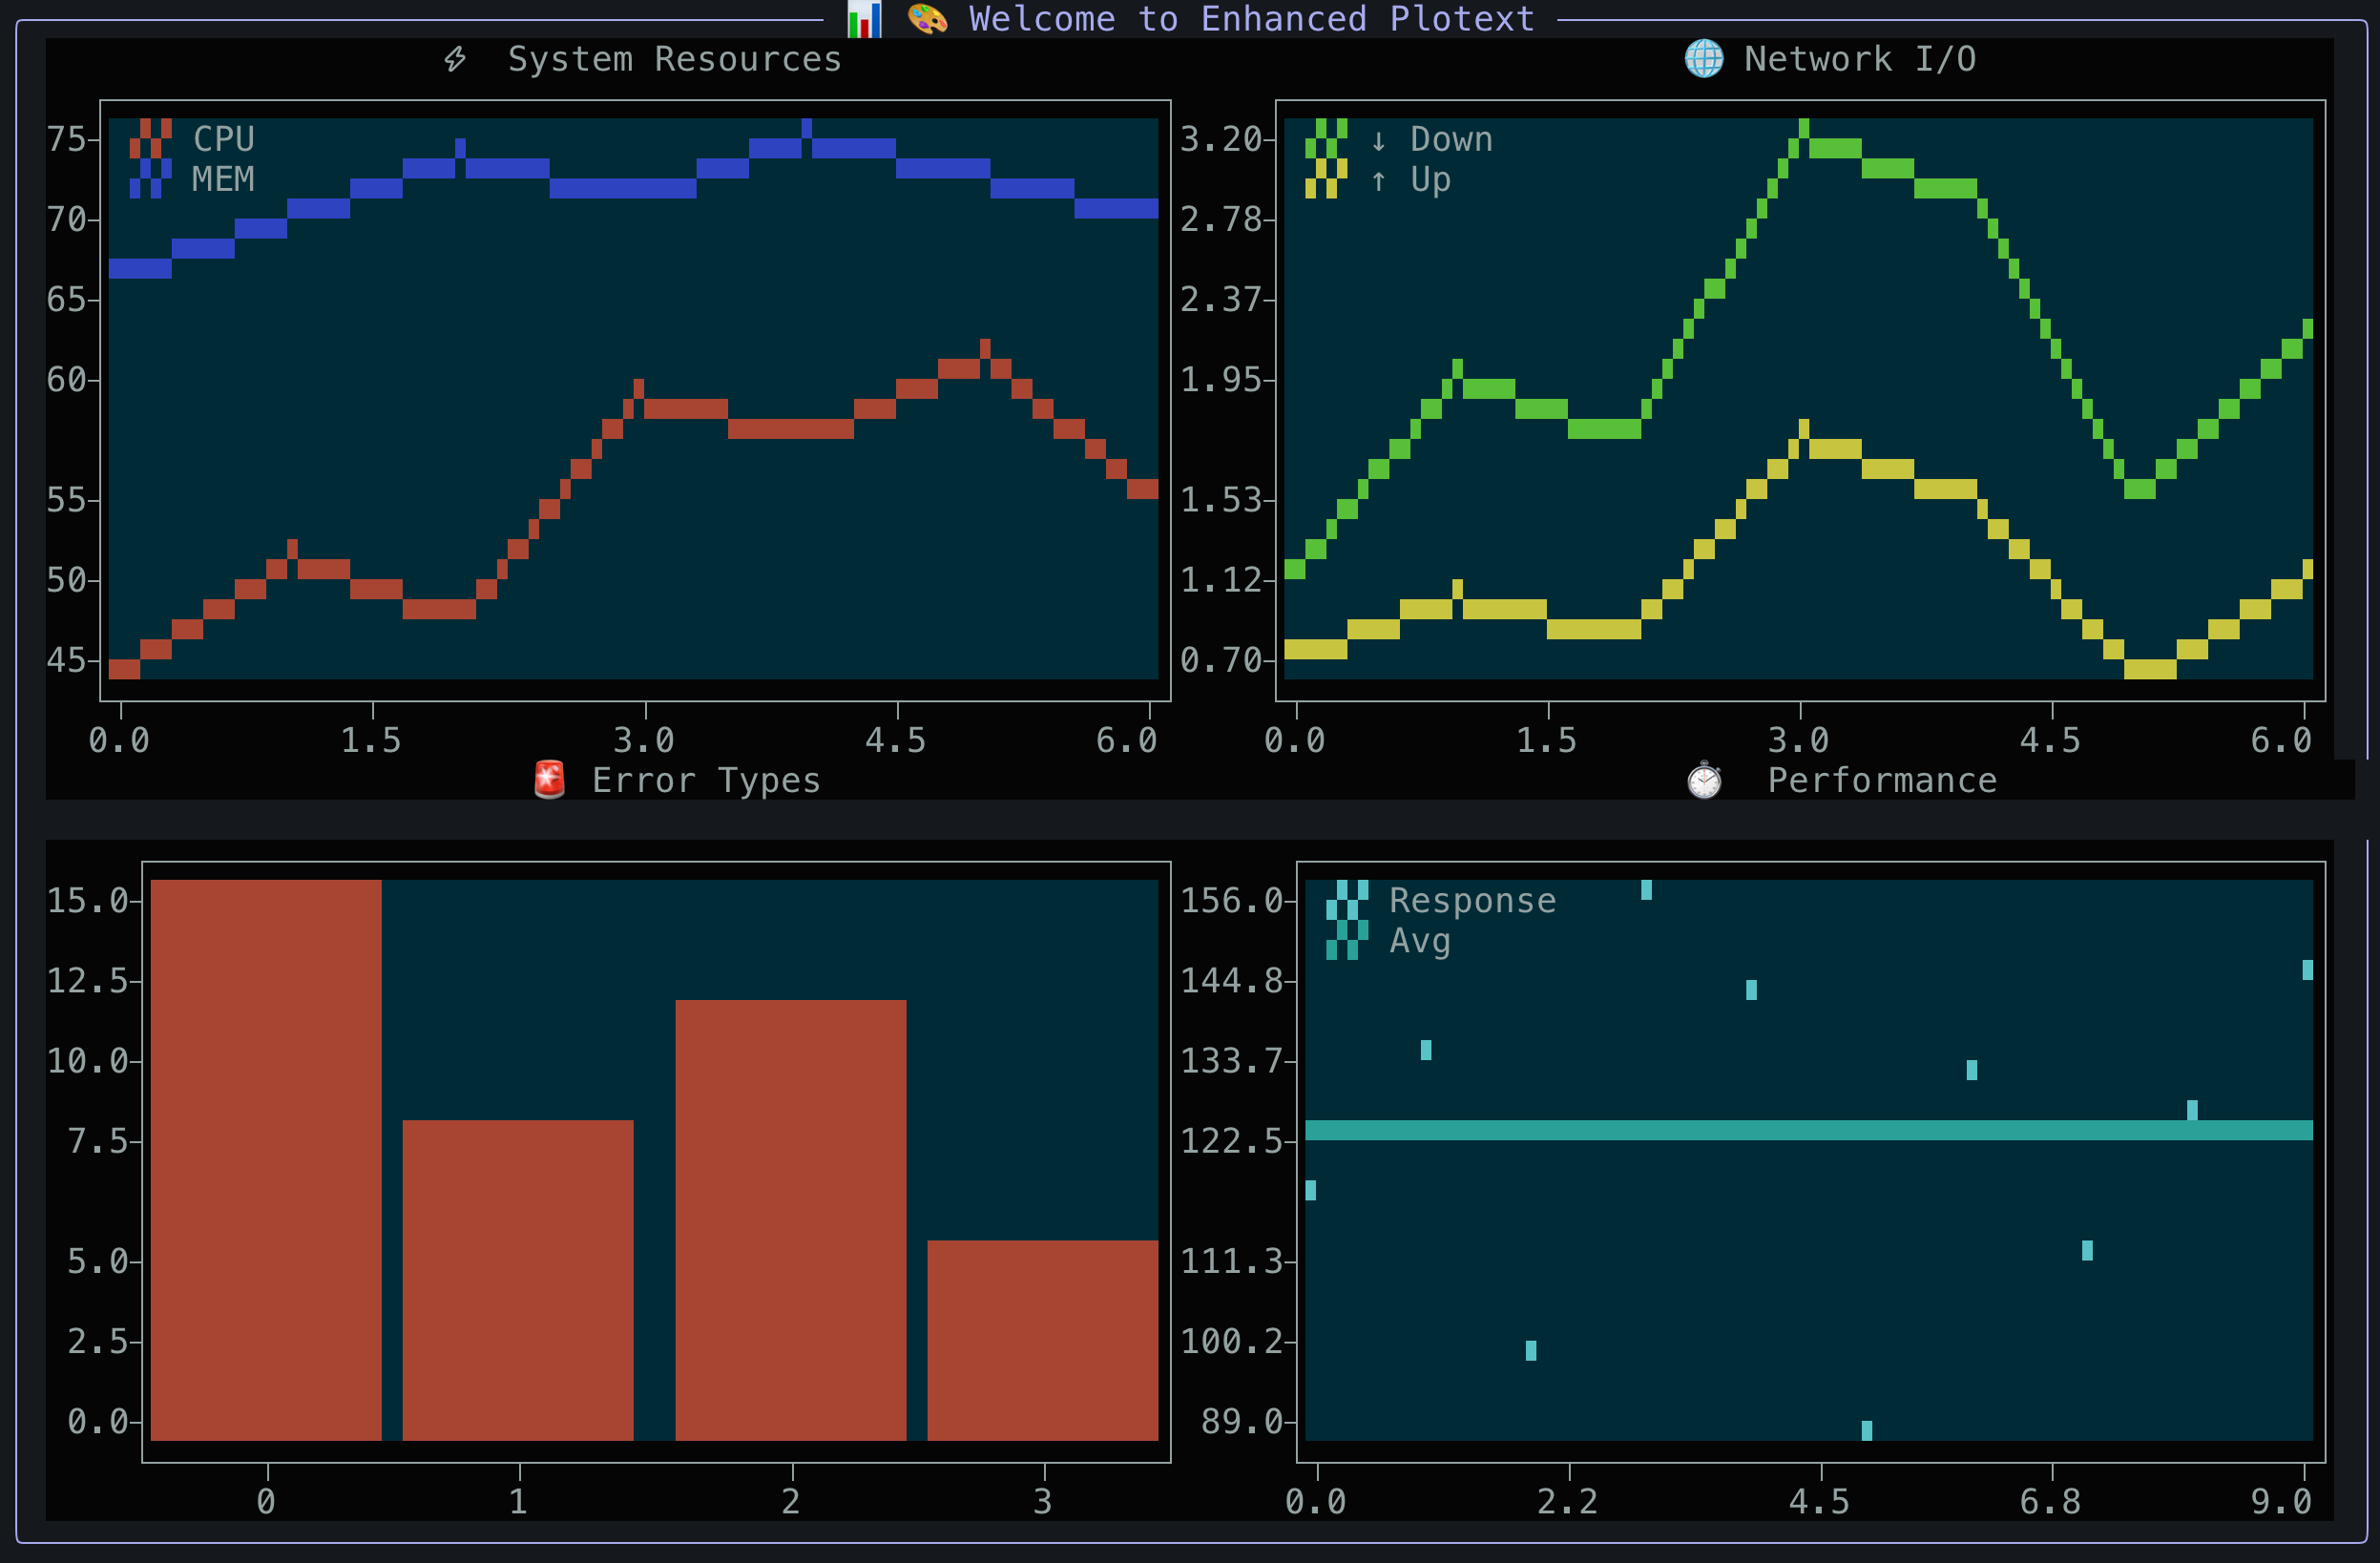
**Plotext+ plots directly in your terminal** with stunning visuals, modern APIs, and professional styling. Plotext+ is a redesigned version of the original [plotext](https://github.com/piccolomo/plotext) library by Savino Piccolomo. New features include an updated API with object oriented features, an MCP server to make the project easily usable with AI & LLM scenarios, new themes and integration with chuk-term to make sure it works in the awesome [mcp-cli](https://github.com/chrishayuk/mcp-cli) by Chris Hay.
## ✨ Key Features
🎯 **Multiple Plot Types**: [scatter](docs/basic.md#scatter-plot), [line](docs/basic.md#line-plot), [bar](docs/bar.md), [histogram](docs/bar.md#histogram-plot), [candlestick](docs/datetime.md#candlestick-plot), [heatmap](docs/special.md), [confusion matrix](docs/special.md#confusion-matrix), [pie](docs/basic.md#pie-plot), [doughnut](docs/basic.md#doughnut-charts) and more
🎨 **Rich Visuals**: [Banner mode](docs/chart_classes.md), [themes](docs/themes.md), [colored text](docs/utilities.md#colored-text), automatic terminal width detection
📊 **Advanced Features**: [Subplots](docs/subplots.md), [datetime plots](docs/datetime.md), [image/GIF display](docs/image.md), [video streaming](docs/video.md) (including YouTube)
🔧 **Modern APIs**: Clean public API, object-oriented charts, quick functions, 100% backward compatible
🤖 **AI Integration**: [MCP server](docs/mcp-server.md) for direct AI client access (Claude, etc.)
⚡ **Zero Dependencies**: No required dependencies (optional packages for multimedia and AI integration)
## 🚀 Quick Start
### Installation
```bash
# Modern Python package management
uv add plotext_plus
# Traditional installation
pip install plotext_plus
# With optional dependencies
pip install plotext_plus[image,video] # Multimedia support
pip install plotext_plus[mcp] # AI integration (MCP server)
pip install plotext_plus[image,video,mcp] # All features
```
### Basic Usage
```python
import plotext_plus as plt
# Simple scatter plot
plt.scatter([1, 2, 3, 4], [1, 4, 9, 16])
plt.title("My First Plot")
plt.show()
```
### Enhanced Visual Styling ✨
```python
import plotext_plus as plt
# Enable beautiful banner mode
plt.banner_mode(True, "📊 Data Analysis Dashboard")
# Apply professional themes
plt.theme('professional')
# Create styled plot
plt.plot([1, 2, 3, 4], [1, 4, 2, 3], label="Data Series")
plt.title("Enhanced Line Plot")
plt.xlabel("Time")
plt.ylabel("Values")
plt.show()
```
### Modern Chart Classes 🎯
```python
import plotext_plus as plt
# Object-oriented chart creation with method chaining
chart = (plt.ScatterChart([1, 2, 3, 4], [1, 4, 9, 16])
.title("Scientific Analysis")
.xlabel("X Variable")
.ylabel("Y Variable")
.color('blue')
.show())
# Quick one-liner plots
plt.quick_scatter(x_data, y_data, title="Quick Analysis")
```
### Public API 🔧
```python
import plotext_plus as plt
# Access organized functionality
plt.plotting.bar(categories, values) # Main plotting functions
plt.themes.apply_theme('dark_mode') # Theme management
plt.utilities.log_success("Plot ready!") # Helper utilities
```
### AI Integration 🤖
```bash
# Install with MCP (Model Context Protocol) support
pip install plotext_plus[mcp]
# Start the MCP server for AI clients like Claude
plotext-mcp
```
**Use with Claude Desktop**: Add to your `claude_desktop_config.json`:
```json
{
"mcpServers": {
"plotext-plus": {
"command": "plotext-mcp",
"args": [],
"env": {}
}
}
}
```
Now AI clients can create plots directly:
```text
"Create a scatter plot showing x=[1,2,3,4,5] vs y=[1,4,9,16,25] with title 'Quadratic Function'"
```
## 🏗️ Architecture & API
### Public API Structure
```python
# 🎯 Main Modules (Public API - no underscores)
plotext_plus.plotting # Core plotting functions
plotext_plus.charts # Object-oriented chart classes
plotext_plus.themes # Theme and styling system
plotext_plus.utilities # Helper functions and tools
# 📁 Internal Modules (Private - with underscores)
plotext_plus._core # Internal implementation
plotext_plus._api # Internal API details
plotext_plus._themes # Theme internals
# ... other internal modules
```
### Project Structure
```bash
plotext_plus/
├── src/plotext_plus/ # Modern src-layout
│ ├── plotting.py # 🎯 Main plotting functions (PUBLIC)
│ ├── charts.py # 🎯 Chart classes (PUBLIC)
│ ├── themes.py # 🎯 Theme system (PUBLIC)
│ ├── utilities.py # 🎯 Utilities (PUBLIC)
│ └── _*.py # 🔒 Internal modules (PRIVATE)
├── examples/ # Interactive demos
│ ├── interactive_demo.py # Full interactive showcase
│ └── theme_showcase_demo.py # Theme comparison tool
├── tests/ # Test suites
├── docs/ # Comprehensive documentation
└── pyproject.toml # Modern packaging
```
## 🎨 Enhanced Features
### 🎭 Visual Enhancements
- **Professional Banners**: Automatic width detection and border styling
- **Advanced Theming**: Multiple built-in themes with chuk-term integration
- **Smart Layouts**: Charts automatically resize to fit terminal dimensions
- **Rich Colors**: 24-bit color support with automatic fallbacks
### 🚀 Developer Experience
- **Clean API**: Public modules clearly separated from internals
- **Method Chaining**: Fluent interface for complex plot creation
- **Quick Functions**: One-liner plots for rapid prototyping
- **Type Safety**: Better IDE support and autocomplete
- **Zero Breaking Changes**: 100% backward compatibility guaranteed
## 🧪 Try It Now
```bash
# Install and run interactive demo
pip install plotext_plus
python -c "
import plotext_plus as plt
plt.banner_mode(True, '🎨 Plotext Plus Demo')
plt.scatter([1,2,3,4], [1,4,2,3], color='blue')
plt.title('Welcome to Plotext Plus!')
plt.show()
"
# Run comprehensive demos
git clone https://github.com/ccmitchellusa/plotext_plus.git
cd plotext_plus
python examples/interactive_demo.py # Full interactive showcase
python examples/theme_showcase_demo.py # Theme comparison
```
## 📚 Complete Documentation
### 🎯 **Core Plotting**
- **[📊 Basic Plots](docs/basic.md)** - Scatter, line, and fundamental plotting
- **[📈 Bar Charts](docs/bar.md)** - Bar plots, histograms, and variations
- **[📅 DateTime Plots](docs/datetime.md)** - Time series and candlestick charts
- **[🔬 Special Plots](docs/special.md)** - Heatmaps, confusion matrices, error bars
- **[🎨 Decorator Plots](docs/decorator.md)** - Text, lines, and shape overlays
### 🖼️ **Multimedia & Advanced**
- **[🖼️ Image Plotting](docs/image.md)** - Display images and GIFs in terminal
- **[🎬 Video Streaming](docs/video.md)** - Play videos and YouTube content
- **[📐 Subplots](docs/subplots.md)** - Multiple plots and complex layouts
### ⚙️ **Configuration & Styling**
- **[🎨 Themes](docs/themes.md)** - Built-in themes and customization
- **[⚙️ Settings](docs/settings.md)** - Plot configuration and options
- **[📏 Aspect](docs/aspect.md)** - Size, scaling, and layout control
- **[🔧 Chart Classes](docs/chart_classes.md)** - Object-oriented API reference
### 🛠️ **Tools & Integration**
- **[🔧 Utilities](docs/utilities.md)** - Helper functions and command-line tools
- **[🤖 MCP Server](docs/mcp-server.md)** - AI integration via Model Context Protocol
- **[🌐 Environments](docs/environments.md)** - IDE and platform compatibility
- **[🏗️ API Structure](docs/api.md)** - Clean public API organization
- **[📝 Notes](docs/notes.md)** - Installation, tips, and troubleshooting
### 🚀 **Getting Started Guides**
1. **[👋 Introduction](docs/basic.md#introduction)** - First steps with Plotext
2. **[📦 Installation](docs/notes.md#install)** - Setup and dependencies
3. **[🎯 Quick Examples](#-quick-start)** - Jump right in with code samples
4. **[🎨 Theming Guide](docs/themes.md)** - Make your plots beautiful
5. **[🔧 Modern API Guide](docs/api.md)** - Use the clean public interface
## 💡 Migration & Compatibility
**For Existing Users**: All your current code works unchanged! The new features are purely additive.
**For New Users**: Take advantage of the modern APIs and enhanced styling while learning the fundamentals.
```python
# ✅ Your existing code still works
import plotext_plus as plt
plt.plot([1,2,3], [1,4,2])
plt.show()
# 🆕 Enhanced with new features
plt.banner_mode(True, "📊 My Analysis")
plt.theme('professional')
plt.plot([1,2,3], [1,4,2])
plt.show()
```
Raw data
{
"_id": null,
"home_page": null,
"name": "plotext-plus",
"maintainer": null,
"docs_url": null,
"requires_python": ">=3.11",
"maintainer_email": null,
"keywords": "ai, charts, cli, graphs, mcp, plotting, terminal, visualization",
"author": null,
"author_email": "Chris Mitchell <chris@ccmitchellusa.com>",
"download_url": "https://files.pythonhosted.org/packages/c5/b7/14edf9ae25747676b908092ce502acccb1f43095a6d289ba88aa4db0e16e/plotext_plus-1.0.9.tar.gz",
"platform": null,
"description": "# \ud83d\udcca Plotext+ - Modern Terminal Plotting\n\n[](https://badge.fury.io/py/plotext_plus)\n[](https://pepy.tech/project/plotext_plus)\n[](https://github.com/ccmitchellusa/plotext_plus/issues)\n[](https://github.com/ccmitchellusa/plotext_plus/pulls)\n\n\n\n**Plotext+ plots directly in your terminal** with stunning visuals, modern APIs, and professional styling. Plotext+ is a redesigned version of the original [plotext](https://github.com/piccolomo/plotext) library by Savino Piccolomo. New features include an updated API with object oriented features, an MCP server to make the project easily usable with AI & LLM scenarios, new themes and integration with chuk-term to make sure it works in the awesome [mcp-cli](https://github.com/chrishayuk/mcp-cli) by Chris Hay.\n\n## \u2728 Key Features\n\n\ud83c\udfaf **Multiple Plot Types**: [scatter](docs/basic.md#scatter-plot), [line](docs/basic.md#line-plot), [bar](docs/bar.md), [histogram](docs/bar.md#histogram-plot), [candlestick](docs/datetime.md#candlestick-plot), [heatmap](docs/special.md), [confusion matrix](docs/special.md#confusion-matrix), [pie](docs/basic.md#pie-plot), [doughnut](docs/basic.md#doughnut-charts) and more\n\n\ud83c\udfa8 **Rich Visuals**: [Banner mode](docs/chart_classes.md), [themes](docs/themes.md), [colored text](docs/utilities.md#colored-text), automatic terminal width detection\n\n\ud83d\udcca **Advanced Features**: [Subplots](docs/subplots.md), [datetime plots](docs/datetime.md), [image/GIF display](docs/image.md), [video streaming](docs/video.md) (including YouTube)\n\n\ud83d\udd27 **Modern APIs**: Clean public API, object-oriented charts, quick functions, 100% backward compatible\n\n\ud83e\udd16 **AI Integration**: [MCP server](docs/mcp-server.md) for direct AI client access (Claude, etc.)\n\n\u26a1 **Zero Dependencies**: No required dependencies (optional packages for multimedia and AI integration)\n\n\n\n## \ud83d\ude80 Quick Start\n\n### Installation\n\n```bash\n# Modern Python package management\nuv add plotext_plus\n\n# Traditional installation\npip install plotext_plus\n\n# With optional dependencies\npip install plotext_plus[image,video] # Multimedia support\npip install plotext_plus[mcp] # AI integration (MCP server)\npip install plotext_plus[image,video,mcp] # All features\n```\n\n### Basic Usage\n\n```python\nimport plotext_plus as plt\n\n# Simple scatter plot\nplt.scatter([1, 2, 3, 4], [1, 4, 9, 16])\nplt.title(\"My First Plot\")\nplt.show()\n```\n\n### Enhanced Visual Styling \u2728\n\n```python\nimport plotext_plus as plt\n\n# Enable beautiful banner mode\nplt.banner_mode(True, \"\ud83d\udcca Data Analysis Dashboard\")\n\n# Apply professional themes\nplt.theme('professional')\n\n# Create styled plot\nplt.plot([1, 2, 3, 4], [1, 4, 2, 3], label=\"Data Series\")\nplt.title(\"Enhanced Line Plot\")\nplt.xlabel(\"Time\")\nplt.ylabel(\"Values\")\nplt.show()\n```\n\n### Modern Chart Classes \ud83c\udfaf\n\n```python\nimport plotext_plus as plt\n\n# Object-oriented chart creation with method chaining\nchart = (plt.ScatterChart([1, 2, 3, 4], [1, 4, 9, 16])\n .title(\"Scientific Analysis\")\n .xlabel(\"X Variable\")\n .ylabel(\"Y Variable\")\n .color('blue')\n .show())\n\n# Quick one-liner plots\nplt.quick_scatter(x_data, y_data, title=\"Quick Analysis\")\n```\n\n### Public API \ud83d\udd27\n\n```python\nimport plotext_plus as plt\n\n# Access organized functionality\nplt.plotting.bar(categories, values) # Main plotting functions\nplt.themes.apply_theme('dark_mode') # Theme management \nplt.utilities.log_success(\"Plot ready!\") # Helper utilities\n```\n\n### AI Integration \ud83e\udd16\n\n```bash\n# Install with MCP (Model Context Protocol) support \npip install plotext_plus[mcp]\n\n# Start the MCP server for AI clients like Claude\nplotext-mcp\n```\n\n**Use with Claude Desktop**: Add to your `claude_desktop_config.json`:\n\n```json\n{\n \"mcpServers\": {\n \"plotext-plus\": {\n \"command\": \"plotext-mcp\",\n \"args\": [],\n \"env\": {}\n }\n }\n}\n```\n\nNow AI clients can create plots directly:\n\n```text\n\"Create a scatter plot showing x=[1,2,3,4,5] vs y=[1,4,9,16,25] with title 'Quadratic Function'\"\n```\n\n## \ud83c\udfd7\ufe0f Architecture & API\n\n### Public API Structure\n\n```python\n# \ud83c\udfaf Main Modules (Public API - no underscores)\nplotext_plus.plotting # Core plotting functions\nplotext_plus.charts # Object-oriented chart classes \nplotext_plus.themes # Theme and styling system\nplotext_plus.utilities # Helper functions and tools\n\n# \ud83d\udcc1 Internal Modules (Private - with underscores)\nplotext_plus._core # Internal implementation\nplotext_plus._api # Internal API details\nplotext_plus._themes # Theme internals\n# ... other internal modules\n```\n\n### Project Structure\n\n```bash\nplotext_plus/\n\u251c\u2500\u2500 src/plotext_plus/ # Modern src-layout\n\u2502 \u251c\u2500\u2500 plotting.py # \ud83c\udfaf Main plotting functions (PUBLIC)\n\u2502 \u251c\u2500\u2500 charts.py # \ud83c\udfaf Chart classes (PUBLIC)\n\u2502 \u251c\u2500\u2500 themes.py # \ud83c\udfaf Theme system (PUBLIC)\n\u2502 \u251c\u2500\u2500 utilities.py # \ud83c\udfaf Utilities (PUBLIC)\n\u2502 \u2514\u2500\u2500 _*.py # \ud83d\udd12 Internal modules (PRIVATE)\n\u251c\u2500\u2500 examples/ # Interactive demos\n\u2502 \u251c\u2500\u2500 interactive_demo.py # Full interactive showcase\n\u2502 \u2514\u2500\u2500 theme_showcase_demo.py # Theme comparison tool\n\u251c\u2500\u2500 tests/ # Test suites\n\u251c\u2500\u2500 docs/ # Comprehensive documentation\n\u2514\u2500\u2500 pyproject.toml # Modern packaging\n```\n\n## \ud83c\udfa8 Enhanced Features\n\n### \ud83c\udfad Visual Enhancements\n\n- **Professional Banners**: Automatic width detection and border styling\n- **Advanced Theming**: Multiple built-in themes with chuk-term integration\n- **Smart Layouts**: Charts automatically resize to fit terminal dimensions\n- **Rich Colors**: 24-bit color support with automatic fallbacks\n\n### \ud83d\ude80 Developer Experience \n\n- **Clean API**: Public modules clearly separated from internals\n- **Method Chaining**: Fluent interface for complex plot creation\n- **Quick Functions**: One-liner plots for rapid prototyping\n- **Type Safety**: Better IDE support and autocomplete\n- **Zero Breaking Changes**: 100% backward compatibility guaranteed\n\n## \ud83e\uddea Try It Now\n\n```bash\n# Install and run interactive demo\npip install plotext_plus\npython -c \"\nimport plotext_plus as plt\nplt.banner_mode(True, '\ud83c\udfa8 Plotext Plus Demo')\nplt.scatter([1,2,3,4], [1,4,2,3], color='blue')\nplt.title('Welcome to Plotext Plus!')\nplt.show()\n\"\n\n# Run comprehensive demos\ngit clone https://github.com/ccmitchellusa/plotext_plus.git\ncd plotext_plus\npython examples/interactive_demo.py # Full interactive showcase \npython examples/theme_showcase_demo.py # Theme comparison\n```\n\n## \ud83d\udcda Complete Documentation\n\n### \ud83c\udfaf **Core Plotting**\n\n- **[\ud83d\udcca Basic Plots](docs/basic.md)** - Scatter, line, and fundamental plotting\n- **[\ud83d\udcc8 Bar Charts](docs/bar.md)** - Bar plots, histograms, and variations \n- **[\ud83d\udcc5 DateTime Plots](docs/datetime.md)** - Time series and candlestick charts\n- **[\ud83d\udd2c Special Plots](docs/special.md)** - Heatmaps, confusion matrices, error bars\n- **[\ud83c\udfa8 Decorator Plots](docs/decorator.md)** - Text, lines, and shape overlays\n\n### \ud83d\uddbc\ufe0f **Multimedia & Advanced**\n\n- **[\ud83d\uddbc\ufe0f Image Plotting](docs/image.md)** - Display images and GIFs in terminal\n- **[\ud83c\udfac Video Streaming](docs/video.md)** - Play videos and YouTube content\n- **[\ud83d\udcd0 Subplots](docs/subplots.md)** - Multiple plots and complex layouts\n\n### \u2699\ufe0f **Configuration & Styling**\n\n- **[\ud83c\udfa8 Themes](docs/themes.md)** - Built-in themes and customization\n- **[\u2699\ufe0f Settings](docs/settings.md)** - Plot configuration and options\n- **[\ud83d\udccf Aspect](docs/aspect.md)** - Size, scaling, and layout control\n- **[\ud83d\udd27 Chart Classes](docs/chart_classes.md)** - Object-oriented API reference\n\n### \ud83d\udee0\ufe0f **Tools & Integration** \n\n- **[\ud83d\udd27 Utilities](docs/utilities.md)** - Helper functions and command-line tools\n- **[\ud83e\udd16 MCP Server](docs/mcp-server.md)** - AI integration via Model Context Protocol\n- **[\ud83c\udf10 Environments](docs/environments.md)** - IDE and platform compatibility\n- **[\ud83c\udfd7\ufe0f API Structure](docs/api.md)** - Clean public API organization\n- **[\ud83d\udcdd Notes](docs/notes.md)** - Installation, tips, and troubleshooting\n\n### \ud83d\ude80 **Getting Started Guides**\n\n1. **[\ud83d\udc4b Introduction](docs/basic.md#introduction)** - First steps with Plotext\n2. **[\ud83d\udce6 Installation](docs/notes.md#install)** - Setup and dependencies \n3. **[\ud83c\udfaf Quick Examples](#-quick-start)** - Jump right in with code samples\n4. **[\ud83c\udfa8 Theming Guide](docs/themes.md)** - Make your plots beautiful\n5. **[\ud83d\udd27 Modern API Guide](docs/api.md)** - Use the clean public interface\n\n## \ud83d\udca1 Migration & Compatibility\n\n**For Existing Users**: All your current code works unchanged! The new features are purely additive.\n\n**For New Users**: Take advantage of the modern APIs and enhanced styling while learning the fundamentals.\n\n```python\n# \u2705 Your existing code still works\nimport plotext_plus as plt\nplt.plot([1,2,3], [1,4,2])\nplt.show()\n\n# \ud83c\udd95 Enhanced with new features \nplt.banner_mode(True, \"\ud83d\udcca My Analysis\")\nplt.theme('professional')\nplt.plot([1,2,3], [1,4,2])\nplt.show()\n```\n",
"bugtrack_url": null,
"license": null,
"summary": "Modern terminal plotting library with enhanced visual features, themes, and AI integration",
"version": "1.0.9",
"project_urls": {
"Documentation": "https://github.com/ccmitchellusa/plotext_plus/tree/main/docs",
"Homepage": "https://github.com/ccmitchellusa/plotext_plus",
"Issues": "https://github.com/ccmitchellusa/plotext_plus/issues",
"Repository": "https://github.com/ccmitchellusa/plotext_plus.git"
},
"split_keywords": [
"ai",
" charts",
" cli",
" graphs",
" mcp",
" plotting",
" terminal",
" visualization"
],
"urls": [
{
"comment_text": null,
"digests": {
"blake2b_256": "9ab959d6d2a369df545923ddfb979d380744a0d2e9b7c9e65d0c382baf30b38f",
"md5": "a4035059877f4a2dea90ae16e6a7bd36",
"sha256": "e8dcaf64e09da3dda92bc0e395b72307ce860e599e32f7078a0e6231e89800e1"
},
"downloads": -1,
"filename": "plotext_plus-1.0.9-py3-none-any.whl",
"has_sig": false,
"md5_digest": "a4035059877f4a2dea90ae16e6a7bd36",
"packagetype": "bdist_wheel",
"python_version": "py3",
"requires_python": ">=3.11",
"size": 111740,
"upload_time": "2025-09-06T19:04:52",
"upload_time_iso_8601": "2025-09-06T19:04:52.313662Z",
"url": "https://files.pythonhosted.org/packages/9a/b9/59d6d2a369df545923ddfb979d380744a0d2e9b7c9e65d0c382baf30b38f/plotext_plus-1.0.9-py3-none-any.whl",
"yanked": false,
"yanked_reason": null
},
{
"comment_text": null,
"digests": {
"blake2b_256": "c5b714edf9ae25747676b908092ce502acccb1f43095a6d289ba88aa4db0e16e",
"md5": "8abf1f47993a6390e7be420f8fb6af43",
"sha256": "1a924dcb8a1b43c48ce87d175cc9235f14ff922e82f8829a2cfa27038116c29c"
},
"downloads": -1,
"filename": "plotext_plus-1.0.9.tar.gz",
"has_sig": false,
"md5_digest": "8abf1f47993a6390e7be420f8fb6af43",
"packagetype": "sdist",
"python_version": "source",
"requires_python": ">=3.11",
"size": 168244,
"upload_time": "2025-09-06T19:04:57",
"upload_time_iso_8601": "2025-09-06T19:04:57.285991Z",
"url": "https://files.pythonhosted.org/packages/c5/b7/14edf9ae25747676b908092ce502acccb1f43095a6d289ba88aa4db0e16e/plotext_plus-1.0.9.tar.gz",
"yanked": false,
"yanked_reason": null
}
],
"upload_time": "2025-09-06 19:04:57",
"github": true,
"gitlab": false,
"bitbucket": false,
"codeberg": false,
"github_user": "ccmitchellusa",
"github_project": "plotext_plus",
"travis_ci": false,
"coveralls": false,
"github_actions": false,
"lcname": "plotext-plus"
}

