# pyCirclizely: Circular visualization in Python, plotly implemented


[](https://pypi.python.org/pypi/pycirclizely)
[](https://github.com/Avatar-Cognition/pyCirclizely/actions/workflows/ci.yml)
## Table of contents
- [pyCirclizely: Circular visualization in Python, plotly implemented](#pycirclizely-circular-visualization-in-python-plotly-implemented)
- [Table of contents](#table-of-contents)
- [Overview](#overview)
- [Installation](#installation)
- [API Usage](#api-usage)
- [Code Example](#code-example)
- [1. Circos Plot](#1-circos-plot)
- [2. Circos Plot (Genomics)](#2-circos-plot-genomics)
- [3. Chord Diagram](#3-chord-diagram)
- [4. Phylogenetic Tree](#4-phylogenetic-tree)
- [5. Radar Chart](#5-radar-chart)
- [Not Implemented Features](#not-implemented-features)
## Overview
pyCirclizely is a circular visualization python package refactored from [pyCirclize](https://github.com/moshi4/pyCirclize) to use plotly instead of matplotlib, which in turn was inspired by [circlize](https://github.com/jokergoo/circlize) and [pyCircos](https://github.com/ponnhide/pyCircos).
It includes useful genome and phylogenetic tree visualization methods for the bioinformatics field. More detailed documentation is available [here](https://Avatar-Cognition.github.io/pyCirclizely/).
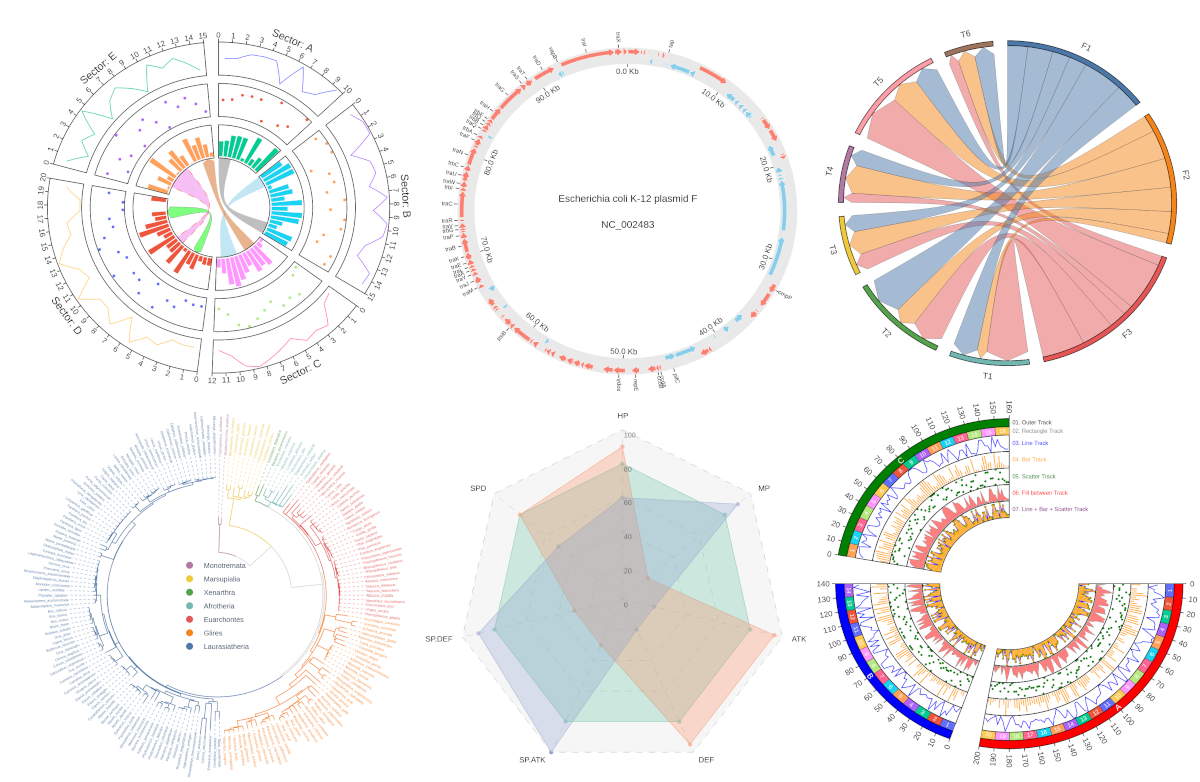\
**Fig.1 pyCirclizely example plot gallery**
## Installation
`Python 3.10 or later` is required for installation.
**Install PyPI package:**
```
pip install pycirclizely
```
**Install conda-forge package:**
```
conda install -c conda-forge pycirclizely
```
## API Usage
API usage is described in each of the following sections in the [documentation](https://Avatar-Cognition.github.io/pyCirclizely/).
- [Getting Started](https://Avatar-Cognition.github.io/pyCirclizely/getting_started/)
- [Plot API Example](https://Avatar-Cognition.github.io/pyCirclizely/plot_api_example/)
- [Chord Diagram](https://Avatar-Cognition.github.io/pyCirclizely/chord_diagram/)
- [Radar Chart](https://Avatar-Cognition.github.io/pyCirclizely/radar_chart/)
- [Circos Genomics Plot (Prokaryotes)](https://Avatar-Cognition.github.io/pyCirclizely/circos_plot_prok/)
- [Circos Genomics Plot (Eukaryotes)](https://Avatar-Cognition.github.io/pyCirclizely/circos_plot_euk/)
- [Comparative Genomics](https://Avatar-Cognition.github.io/pyCirclizely/comparative_genomics/)
- [Phylogenetic Tree](https://Avatar-Cognition.github.io/pyCirclizely/phylogenetic_tree/)
- [Plot Tips](https://Avatar-Cognition.github.io/pyCirclizely/plot_tips/)
## Code Example
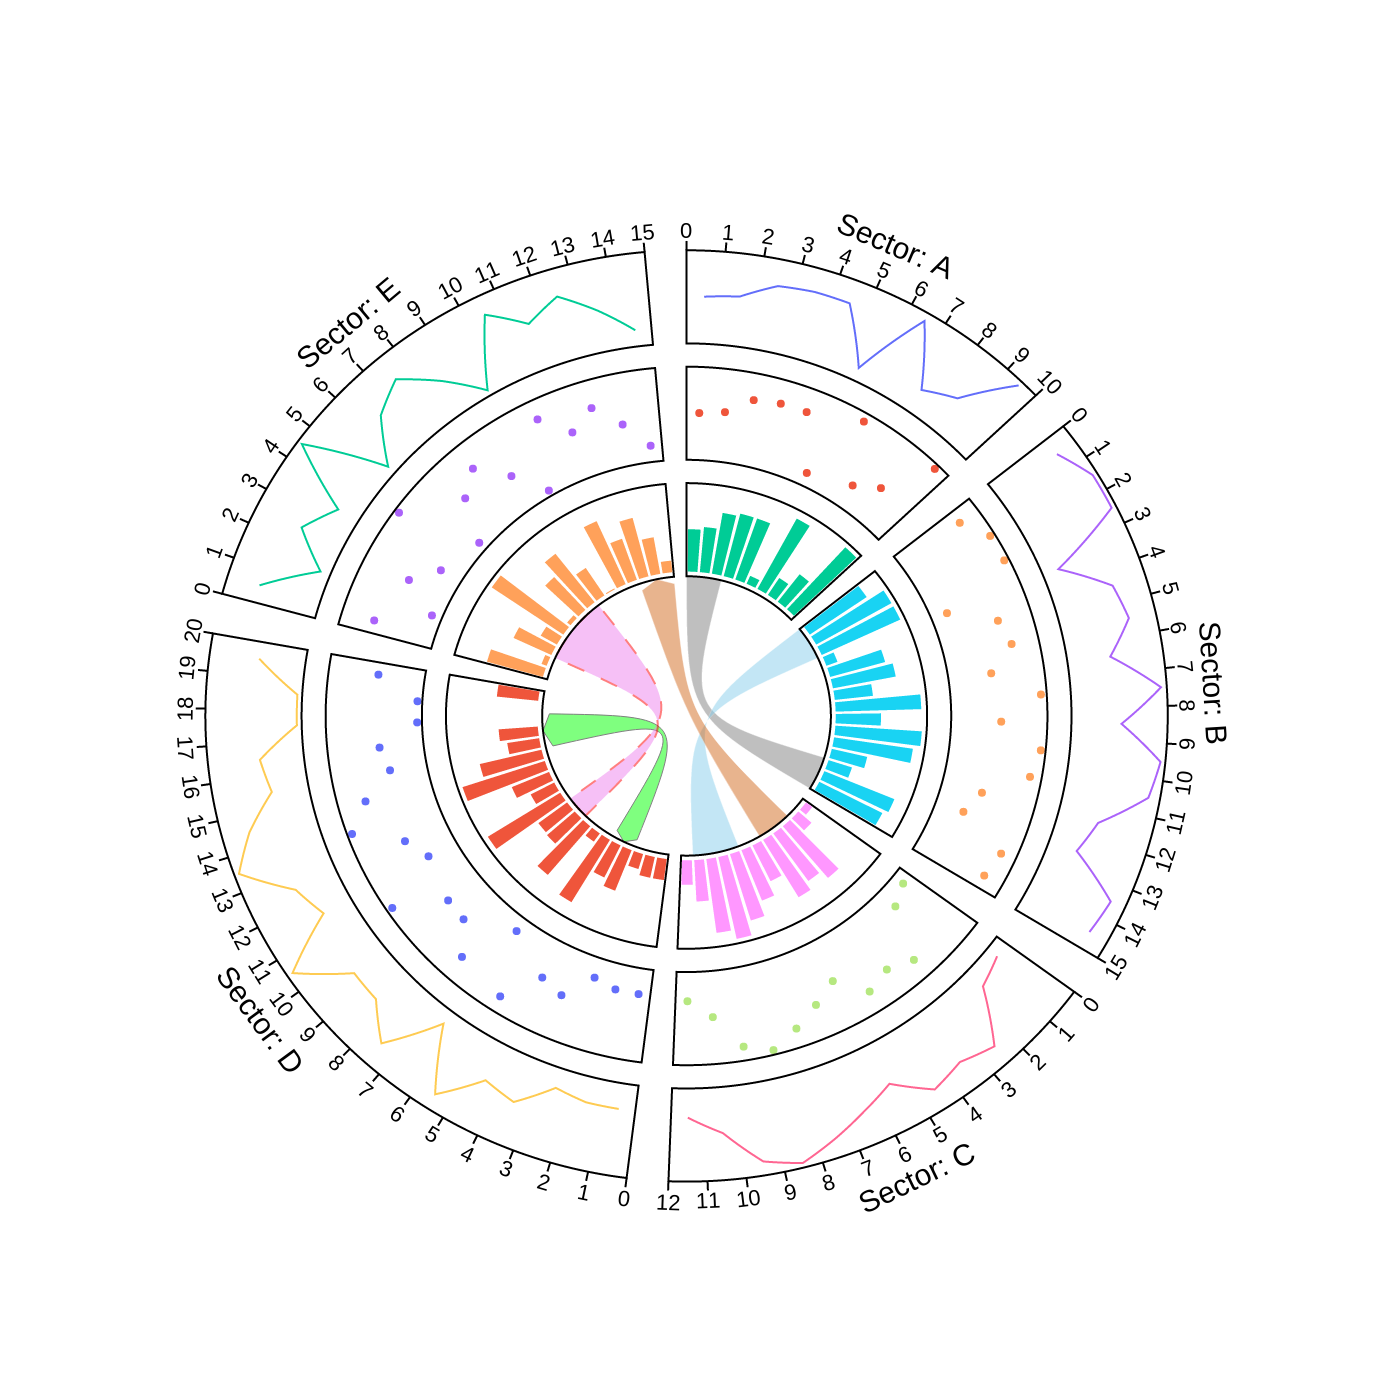
### 1. Circos Plot
```python
from pycirclizely import Circos
import numpy as np
np.random.seed(0)
# Initialize Circos sectors
sectors = {"A": 10, "B": 15, "C": 12, "D": 20, "E": 15}
circos = Circos(sectors, space=5)
for sector in circos.sectors:
# Plot sector name
sector.text(f"Sector: {sector.name}", r=110, font=dict(size=15))
# Create x positions & random y values
x = np.arange(sector.start, sector.end) + 0.5
y = np.random.randint(0, 100, len(x))
# Plot lines
track1 = sector.add_track((80, 100), r_pad_ratio=0.1)
track1.xticks_by_interval(interval=1)
track1.axis()
track1.line(x, y)
# Plot points
track2 = sector.add_track((55, 75), r_pad_ratio=0.1)
track2.axis()
track2.scatter(x, y)
# Plot bars
track3 = sector.add_track((30, 50), r_pad_ratio=0.1)
track3.axis()
track3.bar(x, y)
# Plot links
circos.link(("A", 0, 3), ("B", 15, 12))
circos.link(("B", 0, 3), ("C", 7, 11), fillcolor="skyblue")
circos.link(("C", 2, 5), ("E", 15, 12), fillcolor="chocolate", direction=1)
circos.link(
("D", 3, 5), ("D", 18, 15), fillcolor="lime",
line=dict(color="black", width=0.5), direction=2,
)
circos.link(
("D", 8, 10), ("E", 2, 8), fillcolor="violet",
line=dict(color="red", width=1.0, dash="dash"),
)
fig = circos.plotfig()
fig.write_image("example01.png", format="png")
```
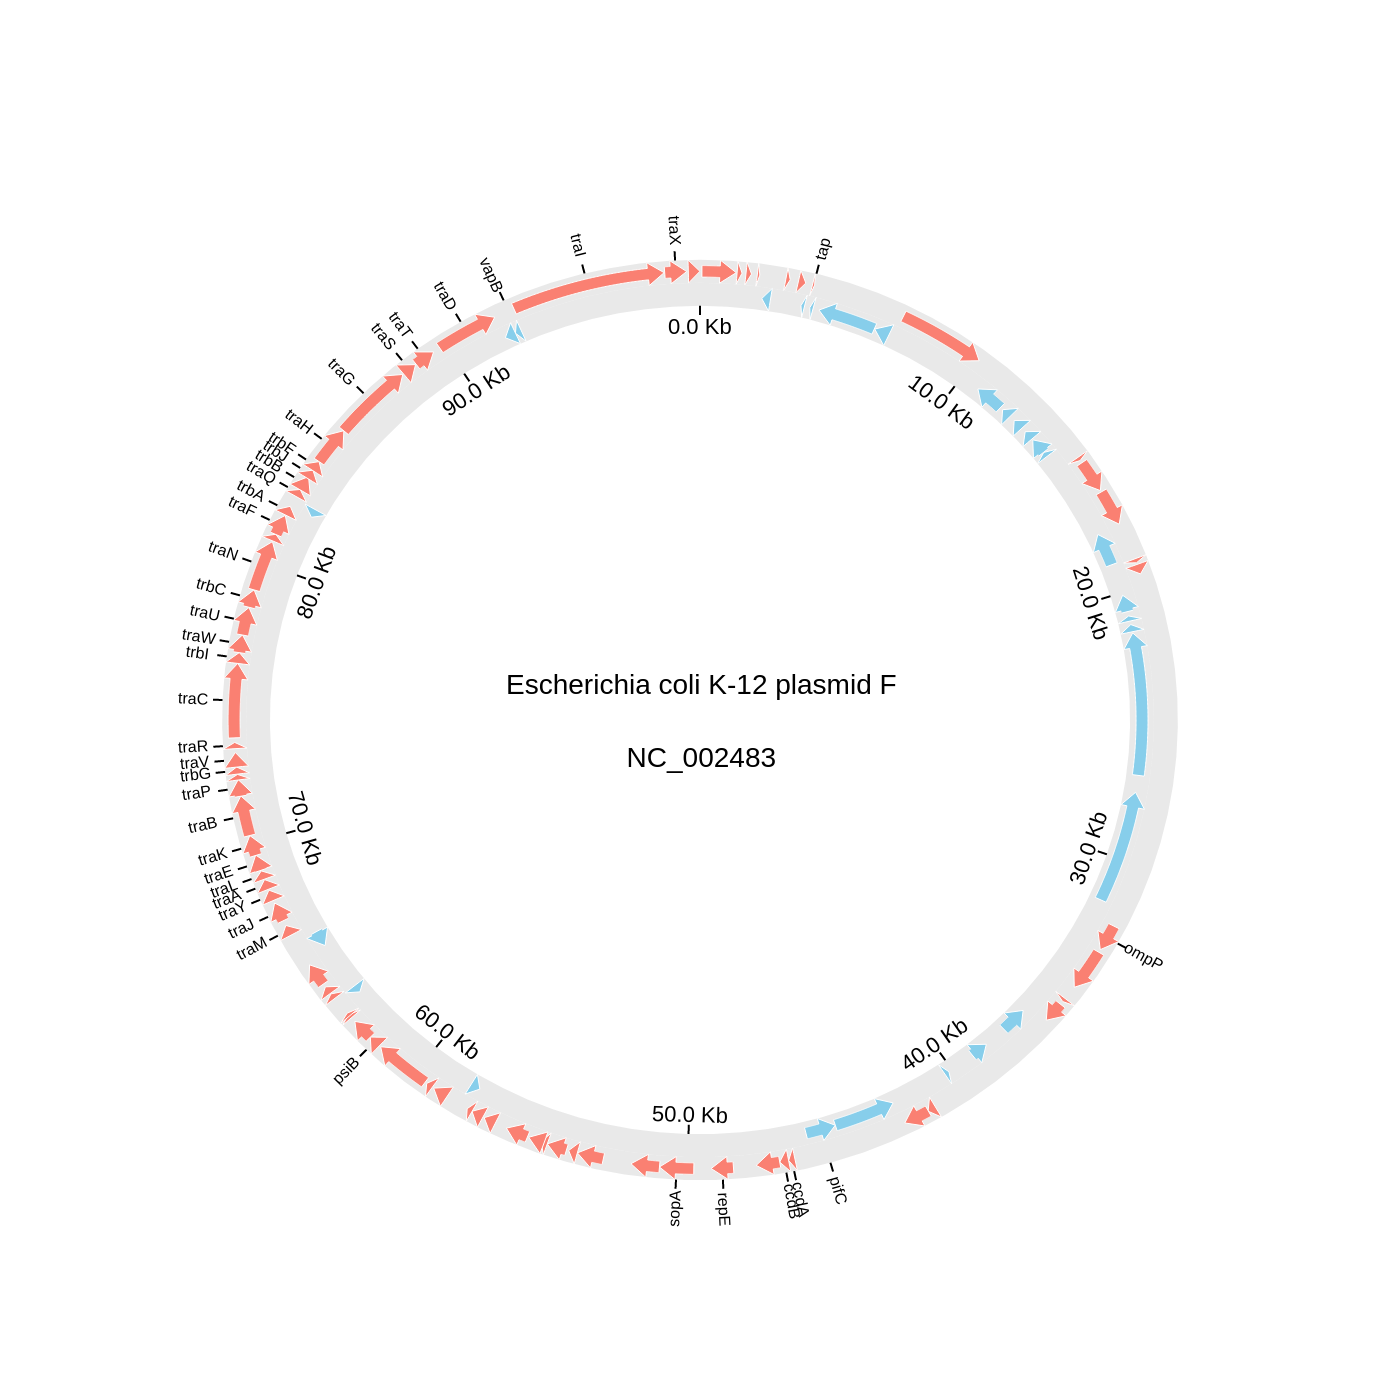
### 2. Circos Plot (Genomics)
```python
from pycirclizely import Circos
from pycirclizely.utils import fetch_genbank_by_accid
from pycirclizely.parser import Genbank
# Download `NC_002483` E.coli plasmid genbank
gbk_fetch_data = fetch_genbank_by_accid("NC_002483")
gbk = Genbank(gbk_fetch_data)
# Initialize Circos instance with genome size
sectors = gbk.get_seqid2size()
space = 0 if len(sectors) == 1 else 2
circos = Circos(sectors, space=space)
circos.text(f"Escherichia coli K-12 plasmid F<br><br>{gbk.name}", font=dict(size=14))
seqid2features = gbk.get_seqid2features(feature_type="CDS")
for sector in circos.sectors:
# Setup track for features plot
f_cds_track = sector.add_track((95, 100))
f_cds_track.axis(fillcolor="lightgrey", line=dict(width=0), opacity=0.5)
r_cds_track = sector.add_track((90, 95))
r_cds_track.axis(fillcolor="lightgrey", line=dict(width=0), opacity=0.5)
# Plot forward/reverse strand CDS
features = seqid2features[sector.name]
for feature in features:
if feature.location.strand == 1:
f_cds_track.genomic_features(
feature, plotstyle="arrow", fillcolor="salmon", line=dict(width=0.5)
)
else:
r_cds_track.genomic_features(
feature, plotstyle="arrow", fillcolor="skyblue", line=dict(width=0.5)
)
# Plot 'gene' qualifier label if exists
labels, label_pos_list = [], []
for feature in features:
start = int(feature.location.start)
end = int(feature.location.end)
label_pos = (start + end) / 2
gene_name = feature.qualifiers.get("gene", [None])[0]
if gene_name is not None:
labels.append(gene_name)
label_pos_list.append(label_pos)
f_cds_track.xticks(
label_pos_list, labels, label_orientation="vertical", text_kws=dict(font=dict(size=8))
)
# Plot xticks (interval = 10 Kb)
r_cds_track.xticks_by_interval(
10000, outer=False, label_formatter=lambda v: f"{v/1000:.1f} Kb"
)
fig = circos.plotfig()
fig.write_image("example02.png", format="png")
```
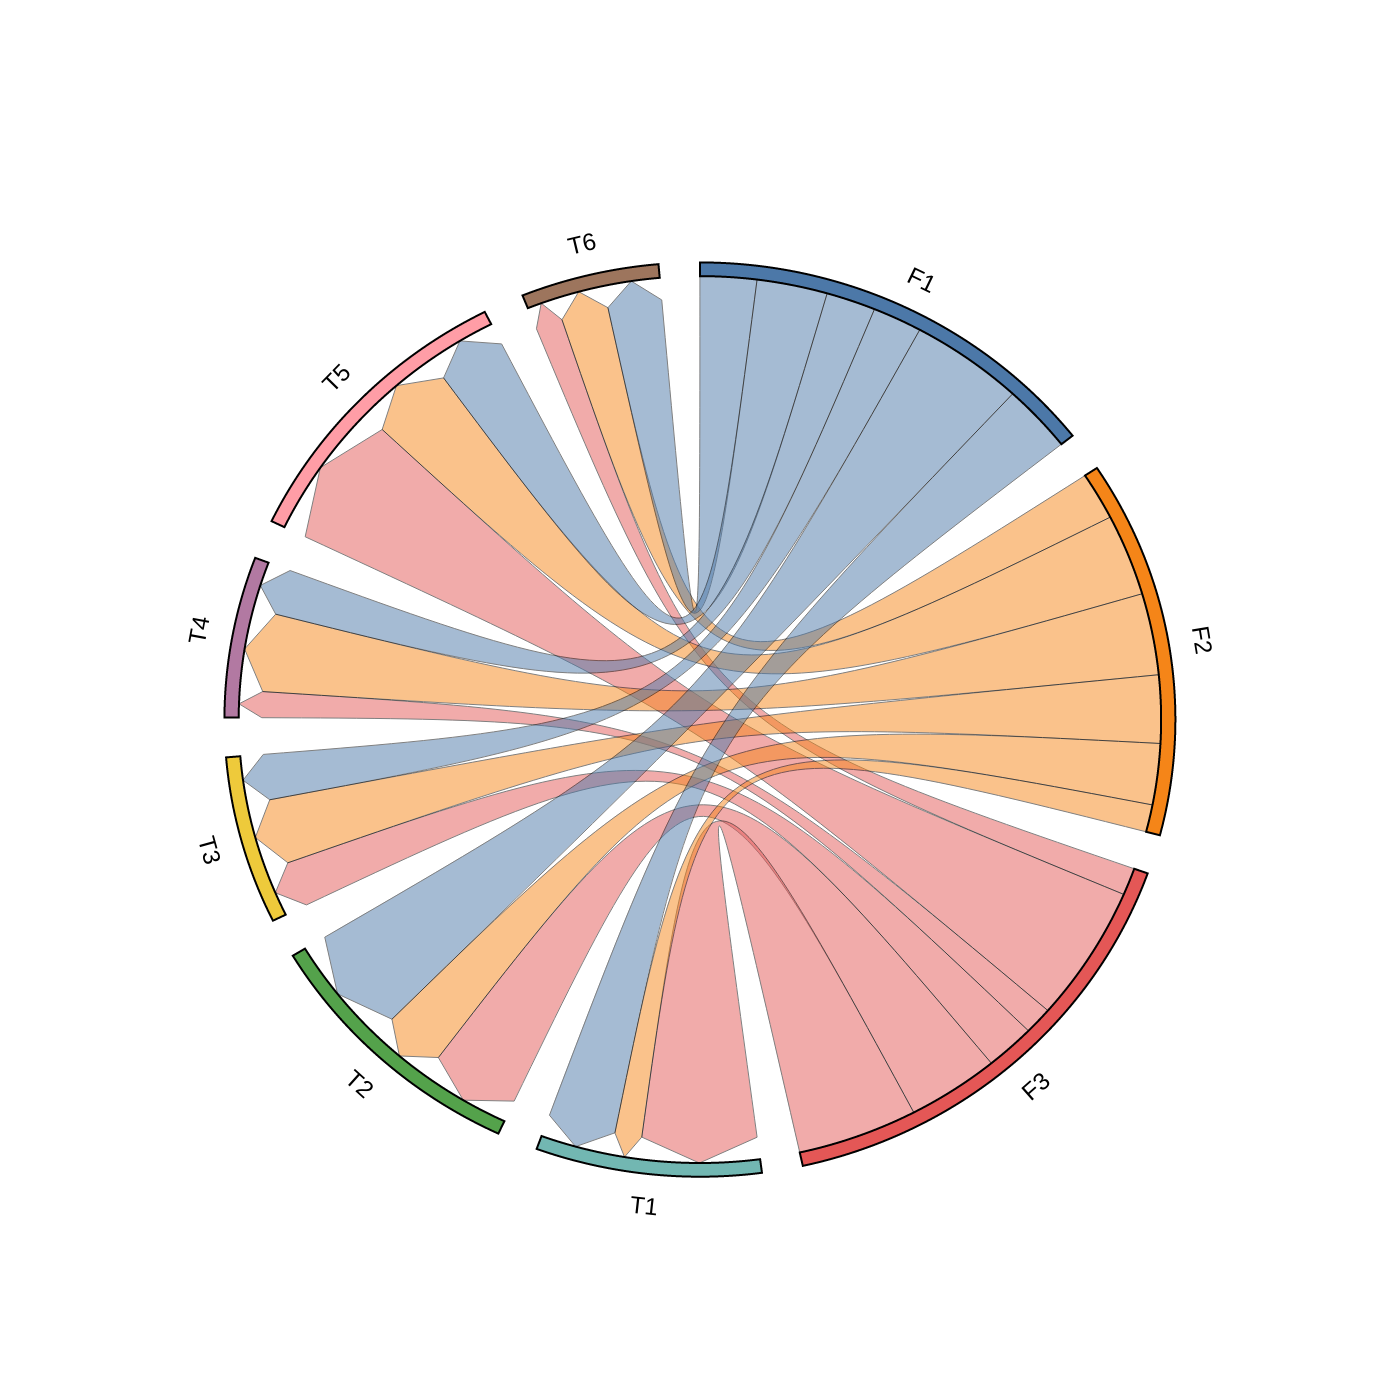
### 3. Chord Diagram
```python
from pycirclizely import Circos
import pandas as pd
# Create matrix dataframe (3 x 6)
row_names = ["F1", "F2", "F3"]
col_names = ["T1", "T2", "T3", "T4", "T5", "T6"]
matrix_data = [
[10, 16, 7, 7, 10, 8],
[4, 9, 10, 12, 12, 7],
[17, 13, 7, 4, 20, 4],
]
matrix_df = pd.DataFrame(matrix_data, index=row_names, columns=col_names)
# Initialize Circos instance for chord diagram plot
circos = Circos.chord_diagram(
matrix_df,
space=5,
cmap="T10",
label_kws=dict(font=dict(size=12)),
link_kws=dict(line=dict(color="black", width=0.5), direction=1),
)
fig = circos.plotfig()
fig.write_image("example03.png", format="png")
```
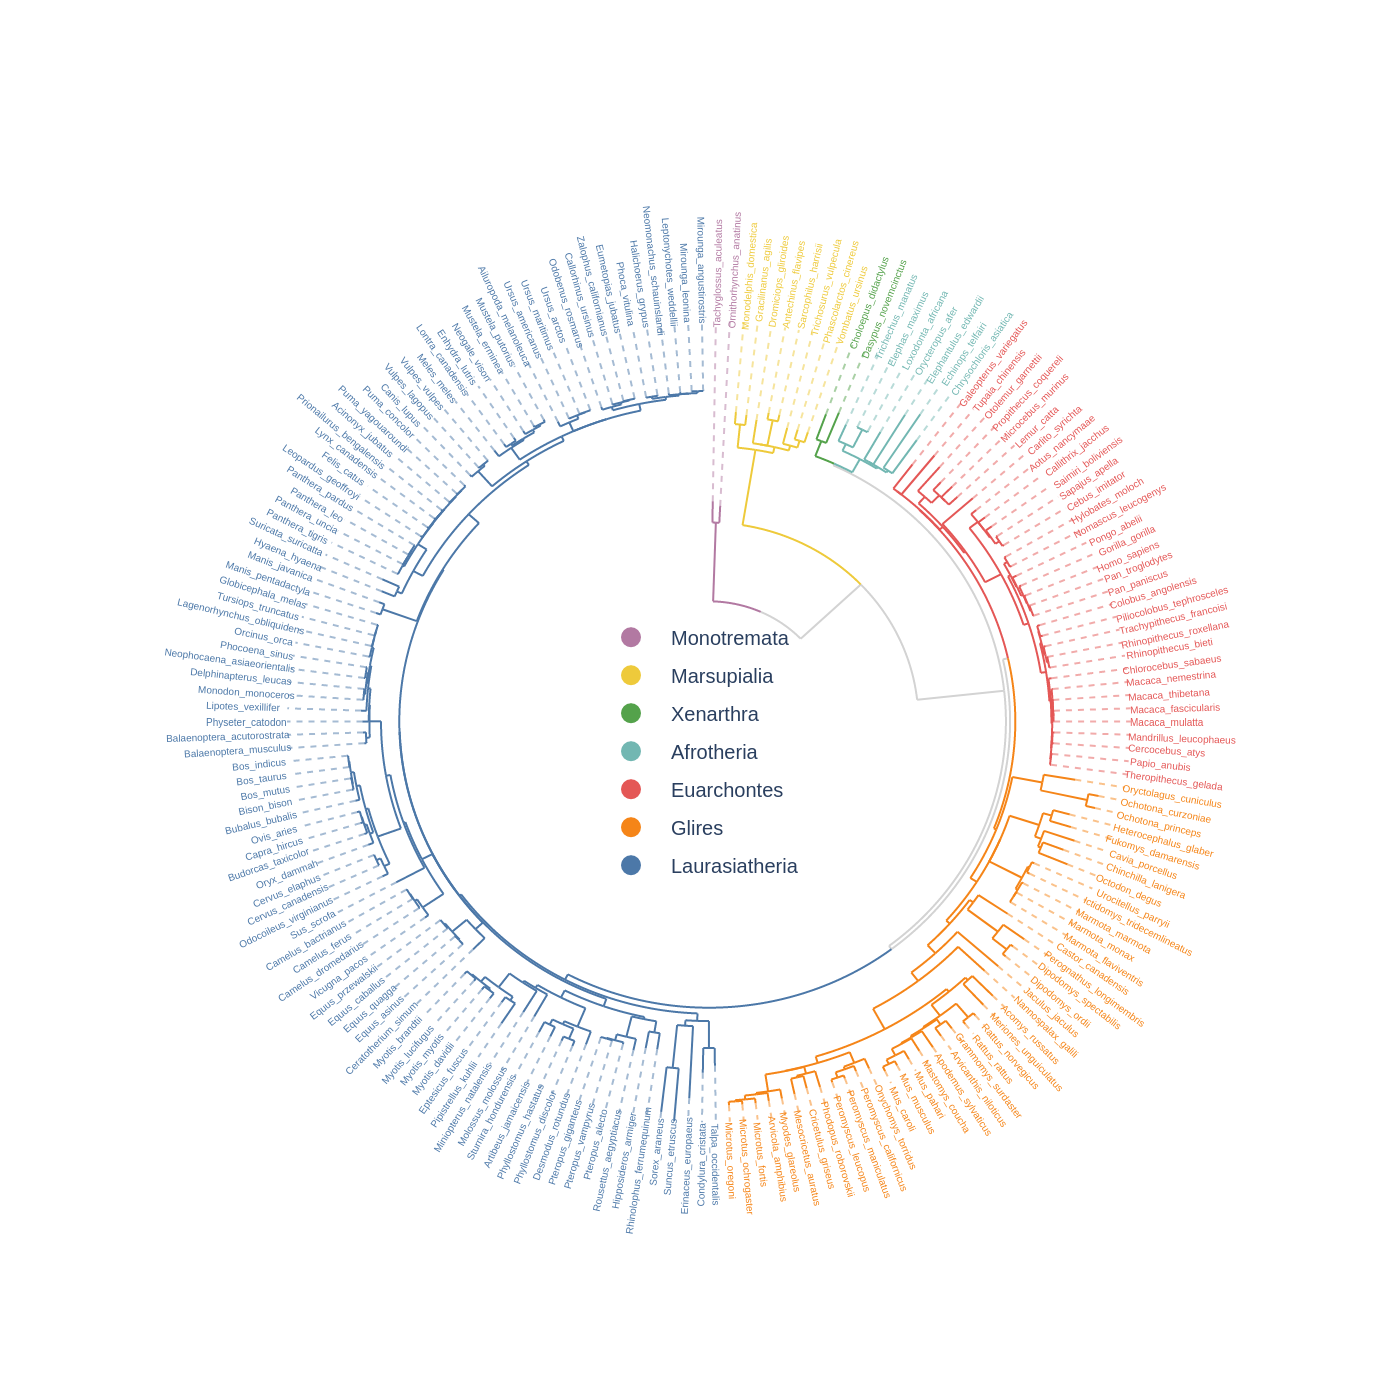
### 4. Phylogenetic Tree
```python
from plotly import graph_objects as go
from pycirclizely import Circos
from pycirclizely.utils import load_example_tree_file, ColorCycler
# Initialize Circos from phylogenetic tree
tree_file = load_example_tree_file("large_example.nwk")
circos, tv = Circos.initialize_from_tree(
tree_file,
r_lim=(30, 100),
leaf_label_size=5,
line_kws=dict(line=dict(color="lightgrey", width=1.0)),
)
# Define group-species dict for tree annotation
# In this example, set minimum species list to specify group's MRCA node
group_name2species_list = dict(
Monotremata=["Tachyglossus_aculeatus", "Ornithorhynchus_anatinus"],
Marsupialia=["Monodelphis_domestica", "Vombatus_ursinus"],
Xenarthra=["Choloepus_didactylus", "Dasypus_novemcinctus"],
Afrotheria=["Trichechus_manatus", "Chrysochloris_asiatica"],
Euarchontes=["Galeopterus_variegatus", "Theropithecus_gelada"],
Glires=["Oryctolagus_cuniculus", "Microtus_oregoni"],
Laurasiatheria=["Talpa_occidentalis", "Mirounga_leonina"],
)
# Set tree line color & label color
color_cycler = ColorCycler("T10")
groups = list(group_name2species_list.keys())
colors = color_cycler.get_colors(len(groups))[::-1]
group_name2color = {name: color for name, color in zip(groups, colors)}
for group_name, species_list in group_name2species_list.items():
color = group_name2color[group_name]
tv.set_node_line_props(
species_list, line=dict(color=color), apply_label_color=True
)
# Plot figure & set legend on center
fig = circos.plotfig()
for group_name, color in group_name2color.items():
# Use a dummy trace to create a legend entry
fig.add_trace(
go.Scatter(
x=[None],
y=None,
mode="markers",
marker=dict(color=color, size=10),
name=group_name,
showlegend=True,
)
)
fig.update_layout(
legend=dict(
x=0.5,
y=0.47,
xanchor="center",
yanchor="middle",
font=dict(size=10),
bgcolor="rgba(255,255,255,0.0)",
)
)
fig.write_image("example04.png", format="png", scale=2)
```
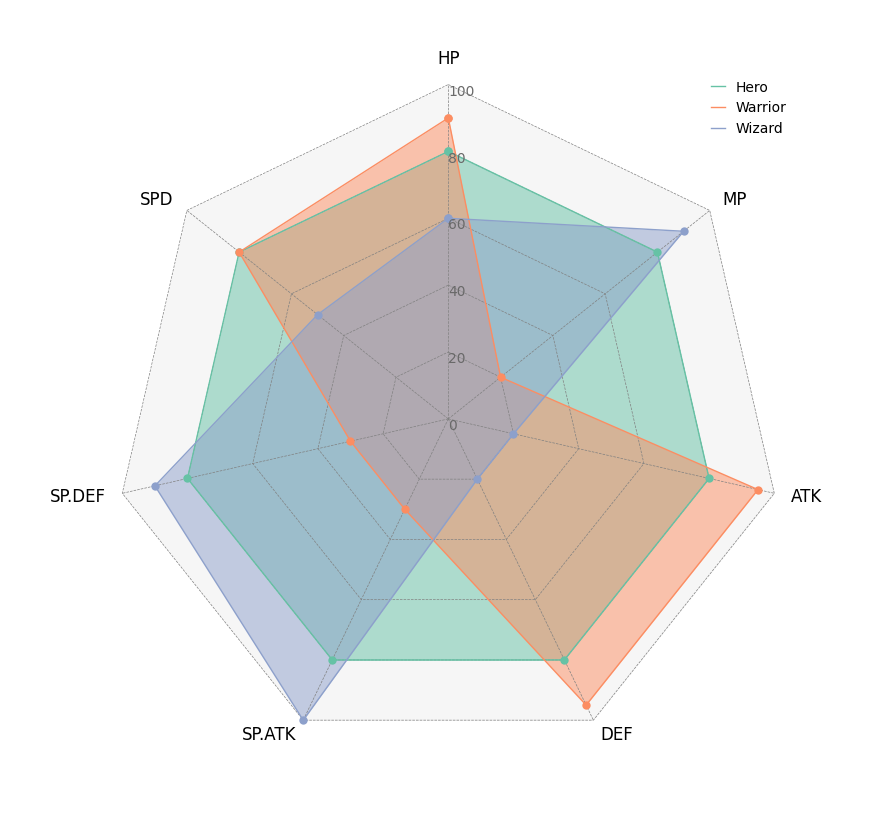
### 5. Radar Chart
```python
from pycirclizely import Circos
import pandas as pd
# Create RPG jobs parameter dataframe (3 jobs, 7 parameters)
df = pd.DataFrame(
data=[
[80, 80, 80, 80, 80, 80, 80],
[90, 20, 95, 95, 30, 30, 80],
[60, 90, 20, 20, 100, 90, 50],
],
index=["Hero", "Warrior", "Wizard"],
columns=["HP", "MP", "ATK", "DEF", "SP.ATK", "SP.DEF", "SPD"],
)
# Initialize Circos instance for radar chart plot
circos = Circos.radar_chart(
df,
vmax=100,
marker_size=6,
grid_interval_ratio=0.2,
)
# Plot figure & set legend on upper right
fig = circos.plotfig()
fig.write_image("example05.png", format="png", scale=2)
```
## Not Implemented Features
Further features to be implemented are the plotly built-in subplot and legend (complementary to the hover text) framework in the package.
Moreover, support for other types of hover info besides hover text will improve the user-plot interaction.
Raw data
{
"_id": null,
"home_page": null,
"name": "pyCirclizely",
"maintainer": null,
"docs_url": null,
"requires_python": ">=3.10",
"maintainer_email": null,
"keywords": "bioinformatics, chord-diagram, circos, plotly, visualization",
"author": null,
"author_email": "mirodriguezgal <miguel.rodriguezgal@gmail.com>",
"download_url": "https://files.pythonhosted.org/packages/51/1b/78641e015b8f4a776387092af41ee65ab61c75811d4695c3ca1d475378c9/pycirclizely-1.0.3.tar.gz",
"platform": null,
"description": "# pyCirclizely: Circular visualization in Python, plotly implemented\n\n\n\n\n[](https://pypi.python.org/pypi/pycirclizely)\n[](https://github.com/Avatar-Cognition/pyCirclizely/actions/workflows/ci.yml)\n\n## Table of contents\n\n- [pyCirclizely: Circular visualization in Python, plotly implemented](#pycirclizely-circular-visualization-in-python-plotly-implemented)\n - [Table of contents](#table-of-contents)\n - [Overview](#overview)\n - [Installation](#installation)\n - [API Usage](#api-usage)\n - [Code Example](#code-example)\n - [1. Circos Plot](#1-circos-plot)\n - [2. Circos Plot (Genomics)](#2-circos-plot-genomics)\n - [3. Chord Diagram](#3-chord-diagram)\n - [4. Phylogenetic Tree](#4-phylogenetic-tree)\n - [5. Radar Chart](#5-radar-chart)\n - [Not Implemented Features](#not-implemented-features)\n\n## Overview\n\npyCirclizely is a circular visualization python package refactored from [pyCirclize](https://github.com/moshi4/pyCirclize) to use plotly instead of matplotlib, which in turn was inspired by [circlize](https://github.com/jokergoo/circlize) and [pyCircos](https://github.com/ponnhide/pyCircos).\n\nIt includes useful genome and phylogenetic tree visualization methods for the bioinformatics field. More detailed documentation is available [here](https://Avatar-Cognition.github.io/pyCirclizely/).\n\n\\\n**Fig.1 pyCirclizely example plot gallery**\n\n## Installation\n\n`Python 3.10 or later` is required for installation.\n\n**Install PyPI package:**\n\n```\npip install pycirclizely\n```\n\n**Install conda-forge package:**\n\n```\nconda install -c conda-forge pycirclizely\n```\n\n## API Usage\n\nAPI usage is described in each of the following sections in the [documentation](https://Avatar-Cognition.github.io/pyCirclizely/).\n\n- [Getting Started](https://Avatar-Cognition.github.io/pyCirclizely/getting_started/)\n- [Plot API Example](https://Avatar-Cognition.github.io/pyCirclizely/plot_api_example/)\n- [Chord Diagram](https://Avatar-Cognition.github.io/pyCirclizely/chord_diagram/)\n- [Radar Chart](https://Avatar-Cognition.github.io/pyCirclizely/radar_chart/)\n- [Circos Genomics Plot (Prokaryotes)](https://Avatar-Cognition.github.io/pyCirclizely/circos_plot_prok/)\n- [Circos Genomics Plot (Eukaryotes)](https://Avatar-Cognition.github.io/pyCirclizely/circos_plot_euk/)\n- [Comparative Genomics](https://Avatar-Cognition.github.io/pyCirclizely/comparative_genomics/)\n- [Phylogenetic Tree](https://Avatar-Cognition.github.io/pyCirclizely/phylogenetic_tree/)\n- [Plot Tips](https://Avatar-Cognition.github.io/pyCirclizely/plot_tips/)\n\n## Code Example\n\n### 1. Circos Plot\n\n```python\nfrom pycirclizely import Circos\nimport numpy as np\nnp.random.seed(0)\n\n# Initialize Circos sectors\nsectors = {\"A\": 10, \"B\": 15, \"C\": 12, \"D\": 20, \"E\": 15}\ncircos = Circos(sectors, space=5)\n\nfor sector in circos.sectors:\n # Plot sector name\n sector.text(f\"Sector: {sector.name}\", r=110, font=dict(size=15))\n # Create x positions & random y values\n x = np.arange(sector.start, sector.end) + 0.5\n y = np.random.randint(0, 100, len(x))\n # Plot lines\n track1 = sector.add_track((80, 100), r_pad_ratio=0.1)\n track1.xticks_by_interval(interval=1)\n track1.axis()\n track1.line(x, y)\n # Plot points \n track2 = sector.add_track((55, 75), r_pad_ratio=0.1)\n track2.axis()\n track2.scatter(x, y)\n # Plot bars\n track3 = sector.add_track((30, 50), r_pad_ratio=0.1)\n track3.axis()\n track3.bar(x, y)\n\n# Plot links \ncircos.link((\"A\", 0, 3), (\"B\", 15, 12))\ncircos.link((\"B\", 0, 3), (\"C\", 7, 11), fillcolor=\"skyblue\")\ncircos.link((\"C\", 2, 5), (\"E\", 15, 12), fillcolor=\"chocolate\", direction=1)\ncircos.link(\n (\"D\", 3, 5), (\"D\", 18, 15), fillcolor=\"lime\", \n line=dict(color=\"black\", width=0.5), direction=2,\n)\ncircos.link(\n (\"D\", 8, 10), (\"E\", 2, 8), fillcolor=\"violet\",\n line=dict(color=\"red\", width=1.0, dash=\"dash\"),\n)\n\nfig = circos.plotfig()\nfig.write_image(\"example01.png\", format=\"png\")\n```\n\n\n\n### 2. Circos Plot (Genomics)\n\n```python\nfrom pycirclizely import Circos\nfrom pycirclizely.utils import fetch_genbank_by_accid\nfrom pycirclizely.parser import Genbank\n\n# Download `NC_002483` E.coli plasmid genbank\ngbk_fetch_data = fetch_genbank_by_accid(\"NC_002483\")\ngbk = Genbank(gbk_fetch_data)\n\n# Initialize Circos instance with genome size\nsectors = gbk.get_seqid2size()\nspace = 0 if len(sectors) == 1 else 2\ncircos = Circos(sectors, space=space)\ncircos.text(f\"Escherichia coli K-12 plasmid F<br><br>{gbk.name}\", font=dict(size=14))\n\nseqid2features = gbk.get_seqid2features(feature_type=\"CDS\")\nfor sector in circos.sectors:\n # Setup track for features plot\n f_cds_track = sector.add_track((95, 100))\n f_cds_track.axis(fillcolor=\"lightgrey\", line=dict(width=0), opacity=0.5)\n r_cds_track = sector.add_track((90, 95))\n r_cds_track.axis(fillcolor=\"lightgrey\", line=dict(width=0), opacity=0.5)\n # Plot forward/reverse strand CDS\n features = seqid2features[sector.name]\n for feature in features:\n if feature.location.strand == 1:\n f_cds_track.genomic_features(\n feature, plotstyle=\"arrow\", fillcolor=\"salmon\", line=dict(width=0.5)\n )\n else:\n r_cds_track.genomic_features(\n feature, plotstyle=\"arrow\", fillcolor=\"skyblue\", line=dict(width=0.5)\n )\n # Plot 'gene' qualifier label if exists\n labels, label_pos_list = [], []\n for feature in features:\n start = int(feature.location.start)\n end = int(feature.location.end)\n label_pos = (start + end) / 2\n gene_name = feature.qualifiers.get(\"gene\", [None])[0]\n if gene_name is not None:\n labels.append(gene_name)\n label_pos_list.append(label_pos)\n f_cds_track.xticks(\n label_pos_list, labels, label_orientation=\"vertical\", text_kws=dict(font=dict(size=8))\n )\n\n # Plot xticks (interval = 10 Kb)\n r_cds_track.xticks_by_interval(\n 10000, outer=False, label_formatter=lambda v: f\"{v/1000:.1f} Kb\"\n )\n\nfig = circos.plotfig()\nfig.write_image(\"example02.png\", format=\"png\")\n```\n\n\n\n### 3. Chord Diagram\n\n```python\nfrom pycirclizely import Circos\nimport pandas as pd\n\n# Create matrix dataframe (3 x 6)\nrow_names = [\"F1\", \"F2\", \"F3\"]\ncol_names = [\"T1\", \"T2\", \"T3\", \"T4\", \"T5\", \"T6\"]\nmatrix_data = [\n [10, 16, 7, 7, 10, 8],\n [4, 9, 10, 12, 12, 7],\n [17, 13, 7, 4, 20, 4],\n]\nmatrix_df = pd.DataFrame(matrix_data, index=row_names, columns=col_names)\n\n# Initialize Circos instance for chord diagram plot\ncircos = Circos.chord_diagram(\n matrix_df,\n space=5,\n cmap=\"T10\",\n label_kws=dict(font=dict(size=12)),\n link_kws=dict(line=dict(color=\"black\", width=0.5), direction=1),\n)\n\nfig = circos.plotfig()\nfig.write_image(\"example03.png\", format=\"png\")\n```\n\n\n\n### 4. Phylogenetic Tree\n\n```python\nfrom plotly import graph_objects as go\nfrom pycirclizely import Circos\nfrom pycirclizely.utils import load_example_tree_file, ColorCycler\n\n# Initialize Circos from phylogenetic tree\ntree_file = load_example_tree_file(\"large_example.nwk\")\ncircos, tv = Circos.initialize_from_tree(\n tree_file,\n r_lim=(30, 100),\n leaf_label_size=5,\n line_kws=dict(line=dict(color=\"lightgrey\", width=1.0)),\n)\n\n# Define group-species dict for tree annotation\n# In this example, set minimum species list to specify group's MRCA node\ngroup_name2species_list = dict(\n Monotremata=[\"Tachyglossus_aculeatus\", \"Ornithorhynchus_anatinus\"],\n Marsupialia=[\"Monodelphis_domestica\", \"Vombatus_ursinus\"],\n Xenarthra=[\"Choloepus_didactylus\", \"Dasypus_novemcinctus\"],\n Afrotheria=[\"Trichechus_manatus\", \"Chrysochloris_asiatica\"],\n Euarchontes=[\"Galeopterus_variegatus\", \"Theropithecus_gelada\"],\n Glires=[\"Oryctolagus_cuniculus\", \"Microtus_oregoni\"],\n Laurasiatheria=[\"Talpa_occidentalis\", \"Mirounga_leonina\"],\n)\n# Set tree line color & label color\ncolor_cycler = ColorCycler(\"T10\")\ngroups = list(group_name2species_list.keys())\ncolors = color_cycler.get_colors(len(groups))[::-1]\ngroup_name2color = {name: color for name, color in zip(groups, colors)}\nfor group_name, species_list in group_name2species_list.items():\n color = group_name2color[group_name]\n tv.set_node_line_props(\n species_list, line=dict(color=color), apply_label_color=True\n )\n\n# Plot figure & set legend on center\nfig = circos.plotfig()\nfor group_name, color in group_name2color.items():\n # Use a dummy trace to create a legend entry\n fig.add_trace(\n go.Scatter(\n x=[None],\n y=None,\n mode=\"markers\",\n marker=dict(color=color, size=10),\n name=group_name,\n showlegend=True,\n )\n )\n\nfig.update_layout(\n legend=dict(\n x=0.5,\n y=0.47,\n xanchor=\"center\",\n yanchor=\"middle\",\n font=dict(size=10),\n bgcolor=\"rgba(255,255,255,0.0)\",\n )\n)\n\nfig.write_image(\"example04.png\", format=\"png\", scale=2)\n```\n\n\n\n### 5. Radar Chart\n\n```python\nfrom pycirclizely import Circos\nimport pandas as pd\n\n# Create RPG jobs parameter dataframe (3 jobs, 7 parameters)\ndf = pd.DataFrame(\n data=[\n [80, 80, 80, 80, 80, 80, 80],\n [90, 20, 95, 95, 30, 30, 80],\n [60, 90, 20, 20, 100, 90, 50],\n ],\n index=[\"Hero\", \"Warrior\", \"Wizard\"],\n columns=[\"HP\", \"MP\", \"ATK\", \"DEF\", \"SP.ATK\", \"SP.DEF\", \"SPD\"],\n)\n\n# Initialize Circos instance for radar chart plot\ncircos = Circos.radar_chart(\n df,\n vmax=100,\n marker_size=6,\n grid_interval_ratio=0.2,\n)\n\n# Plot figure & set legend on upper right\nfig = circos.plotfig()\nfig.write_image(\"example05.png\", format=\"png\", scale=2)\n```\n\n\n\n## Not Implemented Features\n\nFurther features to be implemented are the plotly built-in subplot and legend (complementary to the hover text) framework in the package.\n\nMoreover, support for other types of hover info besides hover text will improve the user-plot interaction.\n",
"bugtrack_url": null,
"license": null,
"summary": "Circular visualization in Python, plotly implemented",
"version": "1.0.3",
"project_urls": {
"repository": "https://github.com/Avatar-Cognition/pyCirclizely"
},
"split_keywords": [
"bioinformatics",
" chord-diagram",
" circos",
" plotly",
" visualization"
],
"urls": [
{
"comment_text": null,
"digests": {
"blake2b_256": "294bec33aba825e1c176c25ad1c1a66b3a86f389e71a2eb271290c7c6b6065e5",
"md5": "56b873aee0326190dfe1500442479f0b",
"sha256": "88f5aaf213a5b4ba97ac705d5fdbb7d2a91724ff58a689ac4b968c963331a29a"
},
"downloads": -1,
"filename": "pycirclizely-1.0.3-py3-none-any.whl",
"has_sig": false,
"md5_digest": "56b873aee0326190dfe1500442479f0b",
"packagetype": "bdist_wheel",
"python_version": "py3",
"requires_python": ">=3.10",
"size": 79814,
"upload_time": "2025-07-22T14:50:39",
"upload_time_iso_8601": "2025-07-22T14:50:39.728683Z",
"url": "https://files.pythonhosted.org/packages/29/4b/ec33aba825e1c176c25ad1c1a66b3a86f389e71a2eb271290c7c6b6065e5/pycirclizely-1.0.3-py3-none-any.whl",
"yanked": false,
"yanked_reason": null
},
{
"comment_text": null,
"digests": {
"blake2b_256": "511b78641e015b8f4a776387092af41ee65ab61c75811d4695c3ca1d475378c9",
"md5": "efb09a0aaec9a2e9aef93eb8b43f40aa",
"sha256": "ce52daa0ce78de89be8bb1f8d9cda133b92dea4d5c15bfb85b25fda726b4abe5"
},
"downloads": -1,
"filename": "pycirclizely-1.0.3.tar.gz",
"has_sig": false,
"md5_digest": "efb09a0aaec9a2e9aef93eb8b43f40aa",
"packagetype": "sdist",
"python_version": "source",
"requires_python": ">=3.10",
"size": 3332980,
"upload_time": "2025-07-22T14:50:45",
"upload_time_iso_8601": "2025-07-22T14:50:45.601630Z",
"url": "https://files.pythonhosted.org/packages/51/1b/78641e015b8f4a776387092af41ee65ab61c75811d4695c3ca1d475378c9/pycirclizely-1.0.3.tar.gz",
"yanked": false,
"yanked_reason": null
}
],
"upload_time": "2025-07-22 14:50:45",
"github": true,
"gitlab": false,
"bitbucket": false,
"codeberg": false,
"github_user": "Avatar-Cognition",
"github_project": "pyCirclizely",
"travis_ci": false,
"coveralls": false,
"github_actions": true,
"lcname": "pycirclizely"
}

