<picture align="center">
<img alt="RamanBiolib logo" style="background:white; padding: 20px;" src="https://raw.githubusercontent.com/mteranm/ramanbiolib/main/doc/logo.png">
</picture>
# RamanBiolib
A Raman spectral search library for biological molecules identification, over a database of 140 components, including lipids, proteins, carbohydrates, amino acids, metabolites, nucleic acids, pigments and others.
The library supports identification via spectral similarity or peak-matching algorithms, using either full spectrum plots or most relevant peak positions. For details on the underlying methods, see our [article](http://dx.doi.org/10.2139/ssrn.5185686).
## Installation
```
pip install ramanbiolib
```
## RamanBiolib Graphical User Interface (GUI)
For the GUI see the project [RamanBiolib-UI](https://github.com/mteranm/ramanbiolib-ui)
## Usage
### Spectra similarity search
Identify an unkown component by its Raman spectrum.
```
spectra_search = SpectraSimilaritySearch(wavenumbers=wavenumbers)
search_results = spectra_search.search(
unknown_spectrum,
class_filter=None,
unique_components_in_results=True,
similarity_method="slk",
similarity_params=25 # Window size
)
```
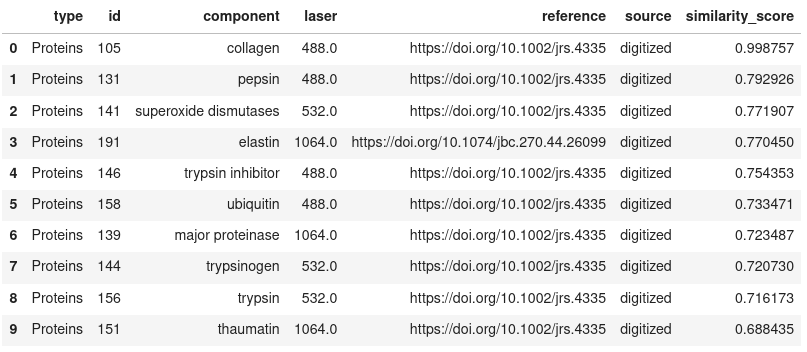
Show the top N results
```
search_results.get_results(limit=10)
```
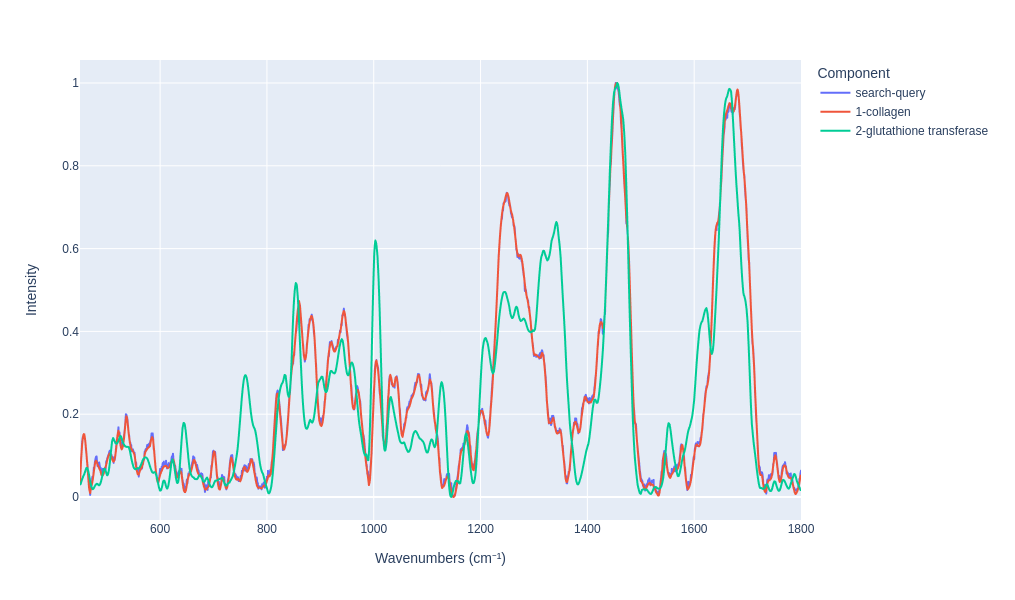
Visualy compare the results
```
search_results.plot_results(n=2)
```
### Peak matching search
Identify an unkown component by its Raman spectrum most relevant peaks positions.
```
pm_search = PeakMatchingSearch(wavenumbers=wavenumbers)
pm_search_results = pm_search.search(
peaks_wavenumbers,
tolerance=5,
class_filter=None,
sort_score='IUR',
min_peak_intensity=0,
tol_penalty="linear",
unique_components_in_results=True
)
```
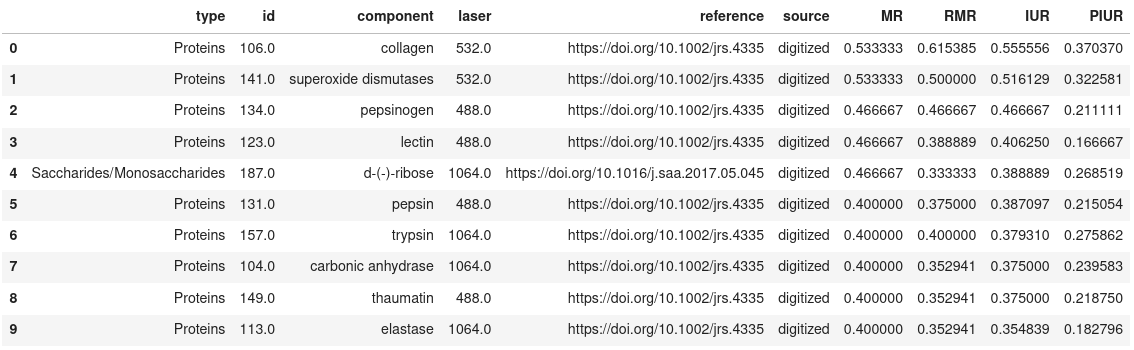
Show the top N results
```
pm_search_results.get_results(limit=10, sort_col='IUR')
```
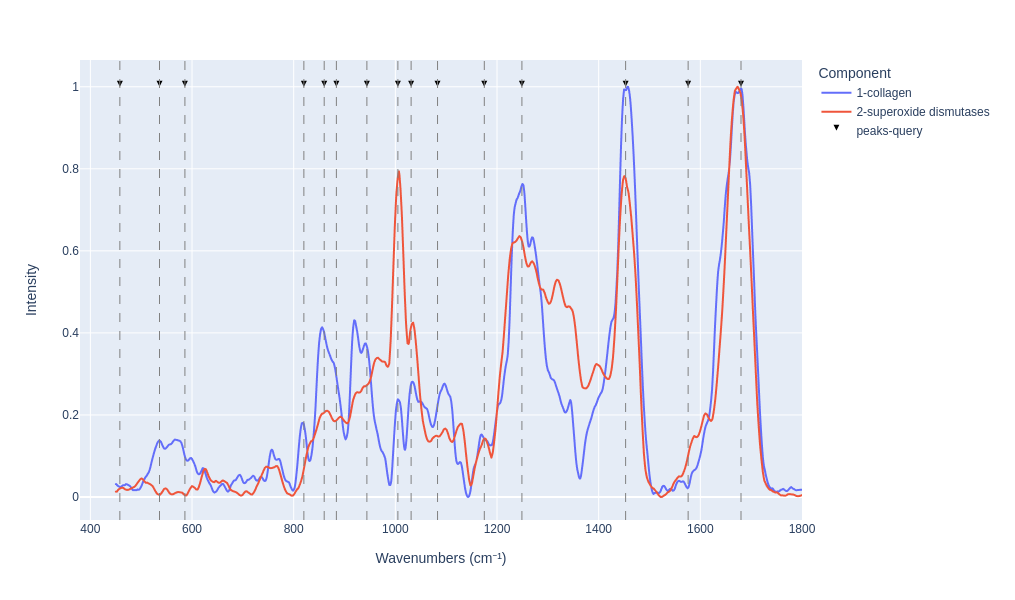
Visualy compare the results
```
pm_search_results.plot_results(n=2)
```
### Examples
- [Search example notebook](https://github.com/mteranm/ramanbiolib/blob/main/examples/search/search-example.ipynb)
### API documentation
[API reference](https://mteranm.github.io/ramanbiolib/)
## How to contribute with Raman spectra
> **Note:** All contributed spectral data will be licensed under ODbL open database license. See the [license section](#license) for details.
The collaborative effort of the research community is essential to expanding this open spectral library for biomolecule identification. We welcome your contributions through the following methods:
### Measured spectra (✅ Preferred Option)
Spectra measured in the laboratory can be included if they are from an isolated pure sample of a biomolecule.
### Articles plots digitazion
As done in the initial version of this database, you can contribute to the digitazion process of the already published Raman spectra in articles figures.
- [Plot figure trace extraction example notebook](https://github.com/mteranm/ramanbiolib/blob/main/examples/extraction/extraction-example.ipynb)
> **Important:** Only spectra digitized from figures in published articles are accepted.
### Contribution process
1. **Fork** this repository.
2. Add your new spectra entries to:
- `raman_spectra_db.csv`
- `raman_peaks_db.csv`
- `metadata_db.csv`
3. **Commit** your changes.
4. Open a **Pull Request (PR)**.
5. Once reviewed and approved, your contribution will be included in the next database release.
To contribute, you need to add new rows with the new spectra information in all database files: raman_spectra_db.csv, raman_peaks_db.csv, and metadata_db.csv.
> **Mandatory Fields:** (M) are mandatory fields, (R) are optional but recommended.
#### Spectra plot (raman_spectra_db.csv)
- **id (M)**: the identifier of the spectrum in this database. This is a incremental id, therefore new specturm will be identified with max_current_id + 1. (This id needs to match with the other files id for the same spectrum measurement)
- **component (M)**: component name (in lower case, if the component is already existing in the database use the same name)
- **wavenumbers (M)**: a list of the spectrum wavenumbers, minimum from 450 to 1800 with a step of 1cm⁻¹ (e.g., "[450, 451, 452, 453, 454, 455, ... , 1800]")
- **intensity (M)**: a list of the spectrum intensity values (e.g., "[0.021540, 0.0215406, ..., 0.0137668])
The spectra needs to be standarized as follows:
> **Standarization:**
> - Smoothed to reduce noise
> - Baseline removed
> - Interpolated to minimum 450-1800 cm⁻¹ with a step of 1 cm⁻¹
> - Min-max normalized
>
#### Peak positions list (raman_peaks_db.csv)
- **id (M)**: the identifier of the spectrum in this database. This is a incremental id, therefore new specturm will be identified with max_current_id + 1. (This id need to match with the other files id for the same spectrum measurement)
- **component (M)**: component name (in lower case, if the component is already existing in the database use the same name)
- **peaks (M)**: the position (in wavenumbers cm⁻¹) of the most relevant peaks, integer values (e.g., "[536, 560, 623, ..., 1612]"). All relevant peaks within the range 450 to 1800 cm⁻¹ need to be added.
- **intensity (M)**: the list of the intensity of the most relevan peaks, after min-max normalization, the list size and order need to match the previous column size. (e.g., "[0.021540, 0.021540, ..., 0.013766])
#### Metadata (metadata_db.csv)
- **id (M)**: the identifier of the spectrum in this database. This is a incremental id, therefore new specturm will be identified with max_current_id + 1. (This id need to match with the other database id for the same spectrum measurement)
- **component (M)**: component name (in lower case, if the component is already existing in the database use the same name)
- **type (M)**: the molecule type tree separated by slash '/', pelase check current types to keep the same structure (e.g., Lipids/FattyAcids)
- **submission_date (M)**: the submission date in format YYYY-MM-DD,
- **contact (M)**: contact data of the person/team who submits data,
- **source (M)**: the value 'digitized' if you obatined the spectra from a digitazion process from article figures, the value 'measured' if are lab measurements.
- **reference (M)**: the reference DOI to the article associated with the data. If the spectrum was digitized, it indicates the article from which the spectrum was obtained. In the case of measurements, this field is mandatory only if there is a related publication.
- **extraction_method (M)**: if spectra were obtained from an external source, specify how it was extracted (digitalization method).
- **peak_identificaton (M)**: method implemented to detect the Raman bands or peaks.,
- **interpolation_method (M)**: interpolation method used to match the wavenumbers of the database.
- **extra_preprocessing (M)**: the specification of additional data treatment implemented after extracting spectra from the external reference and before submitting.
- **complete_sample_name (M)**: the complete name of the sample.
- **sample_source (M)**: the origin of the sample, such as, commercial supplier, commercial reference, environment or tissue provenance.
- **sample_composition (M)**: the sample composition when measured, such as medium, purity and concentration.
- **sample_preparation (R)**: the sample processing performed on the original sample. Also, conditions in which the sample is measured, such as temperature, pH or humidity, etc.
- **sample_substrate (M)**: the components that were used to measure the sample that may introduce further contributions to spectra. For instance, glass, quartz, CaF2 coverslips, microscope slides or cuvettes. In the case of implementing SERS, the nanoparticles and/or the substrate implemented must be specified.
- **raman_technique (M)**: the Raman tecnique used. For instance, spontaneous Raman spectroscopy, Fourier Transform Raman spectroscopy, Surface Enhanced Raman spectroscopy (SERS), Tip Enhanced Raman spectroscopy (TERS), Spatially-Offset Raman spectroscopy (SORS), time-gated Raman, etc.
- **raman_system (M)**: If commercial, provide manufacturer and model reference. If custom built, specify it (M), and provide the commercial references of the different optical components (R). Provide the details, if possible, of laser, monochromator and detector models.
- **delivery_optics (M)**: the delivery/collection optics. If an objective was used, provide commercial reference, numerical aperture, magnification, immersion type. If a fiber-optic Raman probe is used, provide commercial reference, core diameters, numerical aperture if applied, spot size, and probe geometry. Also specify if a pinhole was used for confocality
- **laser_wavelength (M)**: the laser wavelength used in the measurement in nm (e.g. 785.0). If multiple wavelengths are also used, such as the case of Shifted-Excitation Raman Difference Spectroscopy (SERDS), specify them. (e.g. 785.0,1064.0) (float comma separated list)
- **laser_power (M)**: the laser power in mW. In the case of pulsed laser, specify also pulse duration and repetition rate.
- **acquisition_time (M)**: the acquisition time in s. If applied, specify also the number of accumulations and if averaging was performed.
- **orig_spectral_range (R)**: the spectral range of the original measurment in cm⁻¹.
- **orig_spectral_resolution (M)**: the spectral resolution in cm⁻¹. If a grating is used, specify lines/mm.
- **orig_spatial_resolution (R)**: the spatial resolution in um and/or pixel sizes if Raman maps were acquired.
- **detector (R)**: the detector type: e.g. CCD, EMCCD, InGaAs.
- **calibration (R)**: the specification if wavenumber and/or intensity calibration was performed.
- **cropping (R)**: the specification if spectra was truncated from original data, if applied.
- **spike_removal (R)**: the spike removal method, if applied.
- **denoising (M)**: the denoised method implemented and the software, if applied.
- **background_removal (M)**: the background removal method implemented and the software, if applied.
- **baseline_removal (M)**: the baseline removal method implemented and the software, if applied.
- **normalization (R)**: the original normalization method implemented and the software, if applied.
- **additional_info (R)**: further information that might be relevant for the users when considering the spectrum.
## How to cite
Please use the following citation when using this tool:
> M Terán, JJ Ruiz, P Loza-Alvarez, D Masip, D Merino, *Open Raman spectral library for biomolecule identification*, Chemometrics and Intelligent Laboratory Systems, Volume 264, 2025, 105476, ISSN 0169-7439, https://doi.org/10.1016/j.chemolab.2025.105476.
## License
The database files in this repository (the CSV files *raman_peaks_db.csv*, *raman_spectra_db.csv*, and *metadata_db.csv*) are licensed under the **Open Database License (ODbL)**.
- You are free to copy, modify, and share the data, but any adaptations must also be licensed under the same terms (i.e., share-alike).
- You must attribute the source of the data.
See the full details of the Open Database License in the [LICENSE-ODbL](https://raw.githubusercontent.com/mteranm/ramanbiolib/main/LICENSE-ODbL) license file.
The code in this repository is licensed under **GNU General Public License v3**:
See the full details of the GNU General Public License v3 in the [GNU GPL v3](https://raw.githubusercontent.com/mteranm/ramanbiolib/main/LICENSE) license file.
Raw data
{
"_id": null,
"home_page": null,
"name": "ramanbiolib",
"maintainer": null,
"docs_url": null,
"requires_python": "<3.12,>=3.7",
"maintainer_email": null,
"keywords": "raman, spectroscopy, biomolecules",
"author": "Marcelo Teran Miranda",
"author_email": null,
"download_url": "https://files.pythonhosted.org/packages/26/c3/68a3a05eb98b433d8c1a7e4bfd620bf273ae1a4273f913c8a0b4cdd4b8e1/ramanbiolib-1.0.0.post5.tar.gz",
"platform": null,
"description": "<picture align=\"center\">\n <img alt=\"RamanBiolib logo\" style=\"background:white; padding: 20px;\" src=\"https://raw.githubusercontent.com/mteranm/ramanbiolib/main/doc/logo.png\">\n</picture>\n\n\n# RamanBiolib\n\nA Raman spectral search library for biological molecules identification, over a database of 140 components, including lipids, proteins, carbohydrates, amino acids, metabolites, nucleic acids, pigments and others.\n\nThe library supports identification via spectral similarity or peak-matching algorithms, using either full spectrum plots or most relevant peak positions. For details on the underlying methods, see our [article](http://dx.doi.org/10.2139/ssrn.5185686).\n\n## Installation\n\n```\npip install ramanbiolib\n```\n\n## RamanBiolib Graphical User Interface (GUI)\n\nFor the GUI see the project [RamanBiolib-UI](https://github.com/mteranm/ramanbiolib-ui)\n\n## Usage\n\n### Spectra similarity search\nIdentify an unkown component by its Raman spectrum.\n\n```\nspectra_search = SpectraSimilaritySearch(wavenumbers=wavenumbers)\nsearch_results = spectra_search.search(\n unknown_spectrum,\n class_filter=None,\n unique_components_in_results=True,\n similarity_method=\"slk\",\n similarity_params=25 # Window size\n)\n```\n\nShow the top N results\n\n```\nsearch_results.get_results(limit=10)\n```\n\n\nVisualy compare the results\n\n```\nsearch_results.plot_results(n=2)\n```\n\n\n\n\n### Peak matching search\n\nIdentify an unkown component by its Raman spectrum most relevant peaks positions.\n\n```\npm_search = PeakMatchingSearch(wavenumbers=wavenumbers)\npm_search_results = pm_search.search(\n peaks_wavenumbers,\n tolerance=5,\n class_filter=None,\n sort_score='IUR',\n min_peak_intensity=0,\n tol_penalty=\"linear\",\n unique_components_in_results=True\n )\n```\n\nShow the top N results\n\n```\npm_search_results.get_results(limit=10, sort_col='IUR')\n```\n\n\n\n\nVisualy compare the results\n\n```\npm_search_results.plot_results(n=2)\n```\n\n\n\n### Examples\n\n- [Search example notebook](https://github.com/mteranm/ramanbiolib/blob/main/examples/search/search-example.ipynb) \n\n### API documentation\n\n[API reference](https://mteranm.github.io/ramanbiolib/)\n\n## How to contribute with Raman spectra\n\n> **Note:** All contributed spectral data will be licensed under ODbL open database license. See the [license section](#license) for details.\n\nThe collaborative effort of the research community is essential to expanding this open spectral library for biomolecule identification. We welcome your contributions through the following methods:\n\n### Measured spectra (\u2705 Preferred Option)\n\nSpectra measured in the laboratory can be included if they are from an isolated pure sample of a biomolecule.\n\n### Articles plots digitazion\n\nAs done in the initial version of this database, you can contribute to the digitazion process of the already published Raman spectra in articles figures. \n- [Plot figure trace extraction example notebook](https://github.com/mteranm/ramanbiolib/blob/main/examples/extraction/extraction-example.ipynb) \n\n> **Important:** Only spectra digitized from figures in published articles are accepted.\n\n### Contribution process\n\n1. **Fork** this repository.\n2. Add your new spectra entries to:\n - `raman_spectra_db.csv`\n - `raman_peaks_db.csv`\n - `metadata_db.csv`\n3. **Commit** your changes.\n4. Open a **Pull Request (PR)**.\n5. Once reviewed and approved, your contribution will be included in the next database release.\n\nTo contribute, you need to add new rows with the new spectra information in all database files: raman_spectra_db.csv, raman_peaks_db.csv, and metadata_db.csv.\n\n> **Mandatory Fields:** (M) are mandatory fields, (R) are optional but recommended.\n\n#### Spectra plot (raman_spectra_db.csv)\n\n- **id (M)**: the identifier of the spectrum in this database. This is a incremental id, therefore new specturm will be identified with max_current_id + 1. (This id needs to match with the other files id for the same spectrum measurement)\n- **component (M)**: component name (in lower case, if the component is already existing in the database use the same name)\n- **wavenumbers (M)**: a list of the spectrum wavenumbers, minimum from 450 to 1800 with a step of 1cm\u207b\u00b9 (e.g., \"[450, 451, 452, 453, 454, 455, ... , 1800]\")\n- **intensity (M)**: a list of the spectrum intensity values (e.g., \"[0.021540, 0.0215406, ..., 0.0137668])\n\nThe spectra needs to be standarized as follows:\n\n> **Standarization:** \n> - Smoothed to reduce noise\n> - Baseline removed\n> - Interpolated to minimum 450-1800 cm\u207b\u00b9 with a step of 1 cm\u207b\u00b9\n> - Min-max normalized\n> \n\n#### Peak positions list (raman_peaks_db.csv)\n\n- **id (M)**: the identifier of the spectrum in this database. This is a incremental id, therefore new specturm will be identified with max_current_id + 1. (This id need to match with the other files id for the same spectrum measurement)\n- **component (M)**: component name (in lower case, if the component is already existing in the database use the same name)\n- **peaks (M)**: the position (in wavenumbers cm\u207b\u00b9) of the most relevant peaks, integer values (e.g., \"[536, 560, 623, ..., 1612]\"). All relevant peaks within the range 450 to 1800 cm\u207b\u00b9 need to be added.\n- **intensity (M)**: the list of the intensity of the most relevan peaks, after min-max normalization, the list size and order need to match the previous column size. (e.g., \"[0.021540, 0.021540, ..., 0.013766])\n\n#### Metadata (metadata_db.csv)\n\n- **id (M)**: the identifier of the spectrum in this database. This is a incremental id, therefore new specturm will be identified with max_current_id + 1. (This id need to match with the other database id for the same spectrum measurement)\n- **component (M)**: component name (in lower case, if the component is already existing in the database use the same name)\n- **type (M)**: the molecule type tree separated by slash '/', pelase check current types to keep the same structure (e.g., Lipids/FattyAcids) \n- **submission_date (M)**: the submission date in format YYYY-MM-DD, \n- **contact (M)**: contact data of the person/team who submits data,\n- **source (M)**: the value 'digitized' if you obatined the spectra from a digitazion process from article figures, the value 'measured' if are lab measurements.\n- **reference (M)**: the reference DOI to the article associated with the data. If the spectrum was digitized, it indicates the article from which the spectrum was obtained. In the case of measurements, this field is mandatory only if there is a related publication.\n- **extraction_method (M)**: if spectra were obtained from an external source, specify how it was extracted (digitalization method).\n- **peak_identificaton (M)**: method implemented to detect the Raman bands or peaks., \n- **interpolation_method (M)**: interpolation method used to match the wavenumbers of the database.\n- **extra_preprocessing (M)**: the specification of additional data treatment implemented after extracting spectra from the external reference and before submitting.\n- **complete_sample_name (M)**: the complete name of the sample. \n- **sample_source (M)**: the origin of the sample, such as, commercial supplier, commercial reference, environment or tissue provenance. \n- **sample_composition (M)**: the sample composition when measured, such as medium, purity and concentration.\n- **sample_preparation (R)**: the sample processing performed on the original sample. Also, conditions in which the sample is measured, such as temperature, pH or humidity, etc.\n- **sample_substrate (M)**: the components that were used to measure the sample that may introduce further contributions to spectra. For instance, glass, quartz, CaF2 coverslips, microscope slides or cuvettes. In the case of implementing SERS, the nanoparticles and/or the substrate implemented must be specified. \n- **raman_technique (M)**: the Raman tecnique used. For instance, spontaneous Raman spectroscopy, Fourier Transform Raman spectroscopy, Surface Enhanced Raman spectroscopy (SERS), Tip Enhanced Raman spectroscopy (TERS), Spatially-Offset Raman spectroscopy (SORS), time-gated Raman, etc.\n- **raman_system (M)**: If commercial, provide manufacturer and model reference. If custom built, specify it (M), and provide the commercial references of the different optical components (R). Provide the details, if possible, of laser, monochromator and detector models. \n- **delivery_optics (M)**: the delivery/collection optics. If an objective was used, provide commercial reference, numerical aperture, magnification, immersion type. If a fiber-optic Raman probe is used, provide commercial reference, core diameters, numerical aperture if applied, spot size, and probe geometry. Also specify if a pinhole was used for confocality\n- **laser_wavelength (M)**: the laser wavelength used in the measurement in nm (e.g. 785.0). If multiple wavelengths are also used, such as the case of Shifted-Excitation Raman Difference Spectroscopy (SERDS), specify them. (e.g. 785.0,1064.0) (float comma separated list)\n- **laser_power (M)**: the laser power in mW. In the case of pulsed laser, specify also pulse duration and repetition rate.\n- **acquisition_time (M)**: the acquisition time in s. If applied, specify also the number of accumulations and if averaging was performed.\n- **orig_spectral_range (R)**: the spectral range of the original measurment in cm\u207b\u00b9. \n- **orig_spectral_resolution (M)**: the spectral resolution in cm\u207b\u00b9. If a grating is used, specify lines/mm. \n- **orig_spatial_resolution (R)**: the spatial resolution in um and/or pixel sizes if Raman maps were acquired.\n- **detector (R)**: the detector type: e.g. CCD, EMCCD, InGaAs. \n- **calibration (R)**: the specification if wavenumber and/or intensity calibration was performed.\n- **cropping (R)**: the specification if spectra was truncated from original data, if applied.\n- **spike_removal (R)**: the spike removal method, if applied.\n- **denoising (M)**: the denoised method implemented and the software, if applied.\n- **background_removal (M)**: the background removal method implemented and the software, if applied.\n- **baseline_removal (M)**: the baseline removal method implemented and the software, if applied.\n- **normalization (R)**: the original normalization method implemented and the software, if applied. \n- **additional_info (R)**: further information that might be relevant for the users when considering the spectrum.\n\n\n## How to cite\n\nPlease use the following citation when using this tool:\n\n> M Ter\u00e1n, JJ Ruiz, P Loza-Alvarez, D Masip, D Merino, *Open Raman spectral library for biomolecule identification*, Chemometrics and Intelligent Laboratory Systems, Volume 264, 2025, 105476, ISSN 0169-7439, https://doi.org/10.1016/j.chemolab.2025.105476.\n\n## License\n\nThe database files in this repository (the CSV files *raman_peaks_db.csv*, *raman_spectra_db.csv*, and *metadata_db.csv*) are licensed under the **Open Database License (ODbL)**.\n\n- You are free to copy, modify, and share the data, but any adaptations must also be licensed under the same terms (i.e., share-alike).\n- You must attribute the source of the data.\n\nSee the full details of the Open Database License in the [LICENSE-ODbL](https://raw.githubusercontent.com/mteranm/ramanbiolib/main/LICENSE-ODbL) license file.\n\n\nThe code in this repository is licensed under **GNU General Public License v3**:\n\nSee the full details of the GNU General Public License v3 in the [GNU GPL v3](https://raw.githubusercontent.com/mteranm/ramanbiolib/main/LICENSE) license file.\n",
"bugtrack_url": null,
"license": "GNU GPLv3",
"summary": "Biomolecules identification search using Raman spectra.",
"version": "1.0.0.post5",
"project_urls": {
"API Docs": "https://mteranm.github.io/ramanbiolib/",
"Bug Tracker": "https://github.com/mteranm/ramanbiolib/issues",
"Homepage": "https://github.com/mteranm/ramanbiolib",
"Repository": "https://github.com/mteranm/ramanbiolib"
},
"split_keywords": [
"raman",
" spectroscopy",
" biomolecules"
],
"urls": [
{
"comment_text": null,
"digests": {
"blake2b_256": "2213d56c9f386cd697d4238388af596377d229484d169a01297e334fc49d96dc",
"md5": "04a73ed14e03c0d9831e874e5e344d6d",
"sha256": "31a9948e7288471b1873f5199b07ff88a9fc6c424283c9298df3dbe4eb29ce1c"
},
"downloads": -1,
"filename": "ramanbiolib-1.0.0.post5-py3-none-any.whl",
"has_sig": false,
"md5_digest": "04a73ed14e03c0d9831e874e5e344d6d",
"packagetype": "bdist_wheel",
"python_version": "py3",
"requires_python": "<3.12,>=3.7",
"size": 3229032,
"upload_time": "2025-07-16T06:44:55",
"upload_time_iso_8601": "2025-07-16T06:44:55.924559Z",
"url": "https://files.pythonhosted.org/packages/22/13/d56c9f386cd697d4238388af596377d229484d169a01297e334fc49d96dc/ramanbiolib-1.0.0.post5-py3-none-any.whl",
"yanked": false,
"yanked_reason": null
},
{
"comment_text": null,
"digests": {
"blake2b_256": "26c368a3a05eb98b433d8c1a7e4bfd620bf273ae1a4273f913c8a0b4cdd4b8e1",
"md5": "41af7e9924c4762f190bfe8bae6ccb7d",
"sha256": "38b1df3e1305df30f434292b078fdd6b21af8f9cfdadab3464fdfe72794686bd"
},
"downloads": -1,
"filename": "ramanbiolib-1.0.0.post5.tar.gz",
"has_sig": false,
"md5_digest": "41af7e9924c4762f190bfe8bae6ccb7d",
"packagetype": "sdist",
"python_version": "source",
"requires_python": "<3.12,>=3.7",
"size": 4354430,
"upload_time": "2025-07-16T06:44:57",
"upload_time_iso_8601": "2025-07-16T06:44:57.271623Z",
"url": "https://files.pythonhosted.org/packages/26/c3/68a3a05eb98b433d8c1a7e4bfd620bf273ae1a4273f913c8a0b4cdd4b8e1/ramanbiolib-1.0.0.post5.tar.gz",
"yanked": false,
"yanked_reason": null
}
],
"upload_time": "2025-07-16 06:44:57",
"github": true,
"gitlab": false,
"bitbucket": false,
"codeberg": false,
"github_user": "mteranm",
"github_project": "ramanbiolib",
"travis_ci": false,
"coveralls": false,
"github_actions": true,
"requirements": [
{
"name": "scipy",
"specs": [
[
"==",
"1.7.3"
]
]
},
{
"name": "numpy",
"specs": [
[
"==",
"1.21.6"
]
]
},
{
"name": "pandas",
"specs": [
[
"==",
"1.3.5"
]
]
},
{
"name": "plotly",
"specs": [
[
"==",
"5.5.0"
]
]
}
],
"lcname": "ramanbiolib"
}

