# <img src="https://raw.githubusercontent.com/steveberardi/starplot/main/docs/images/favicon.svg" width="48" style="vertical-align:middle"> Starplot


**Starplot** is a Python library for creating star charts and maps of the sky.
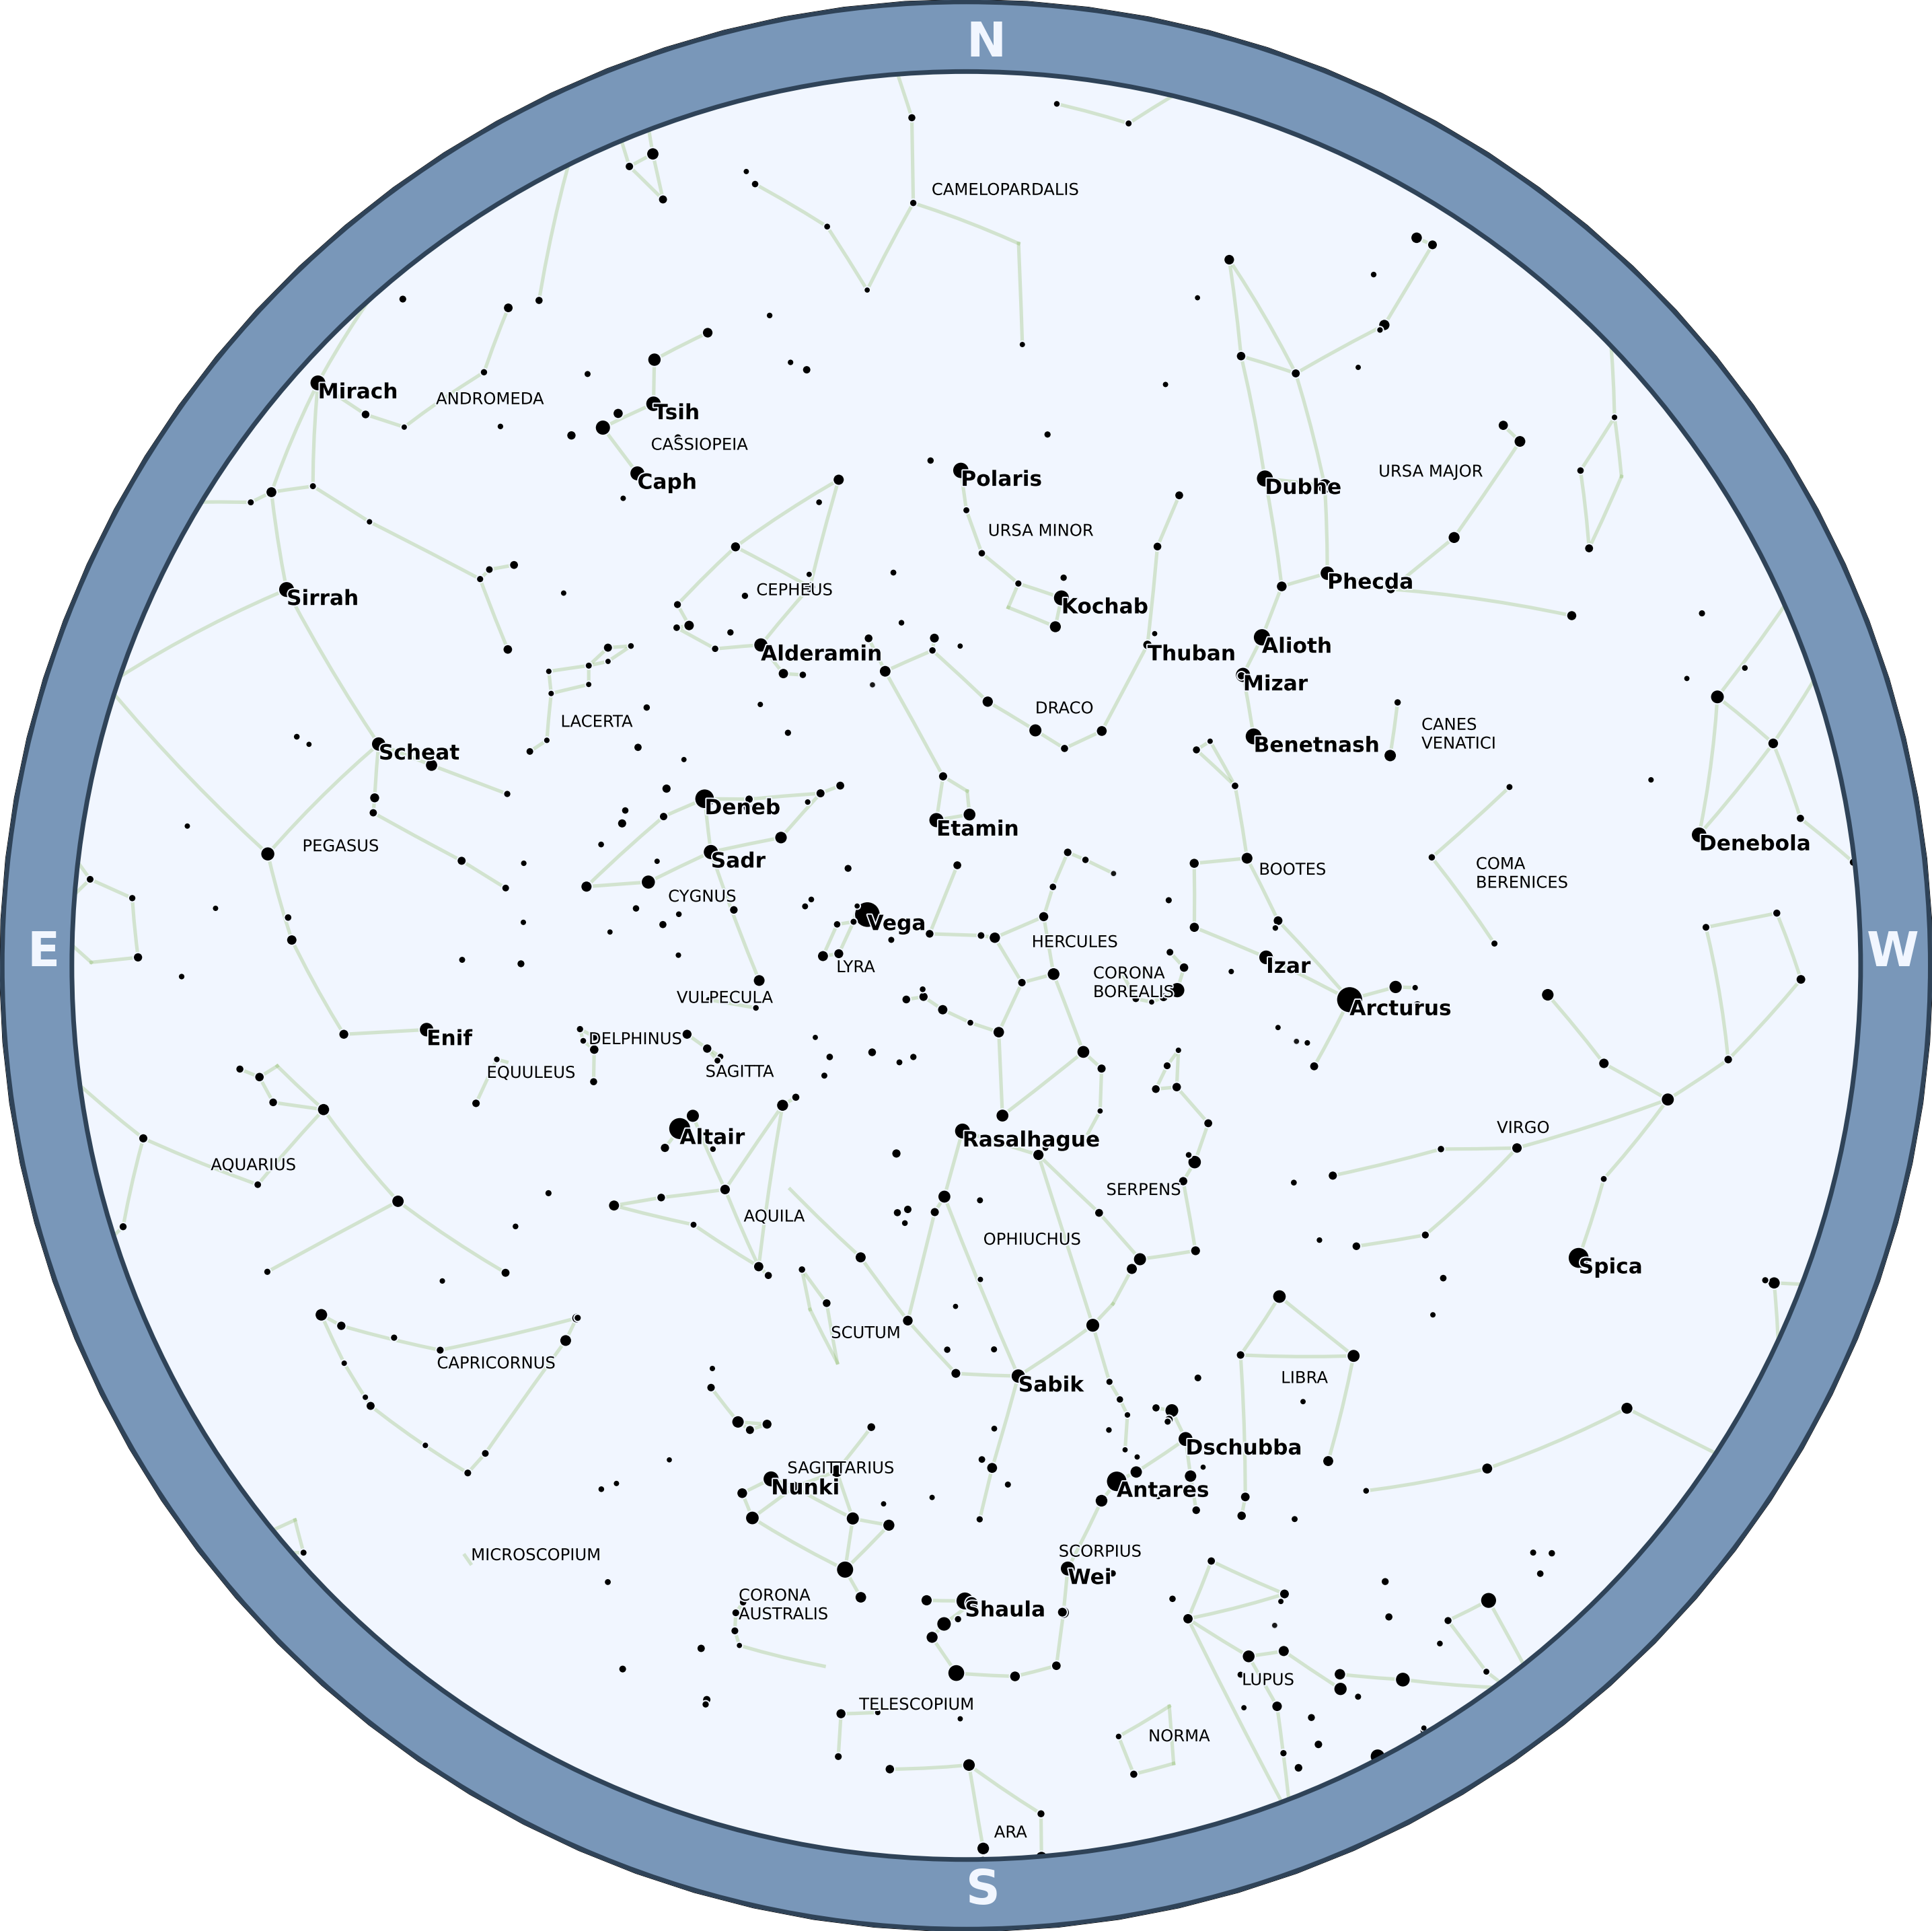
- ⭐ **Zenith Plots** - shows the entire sky at a specific time and place
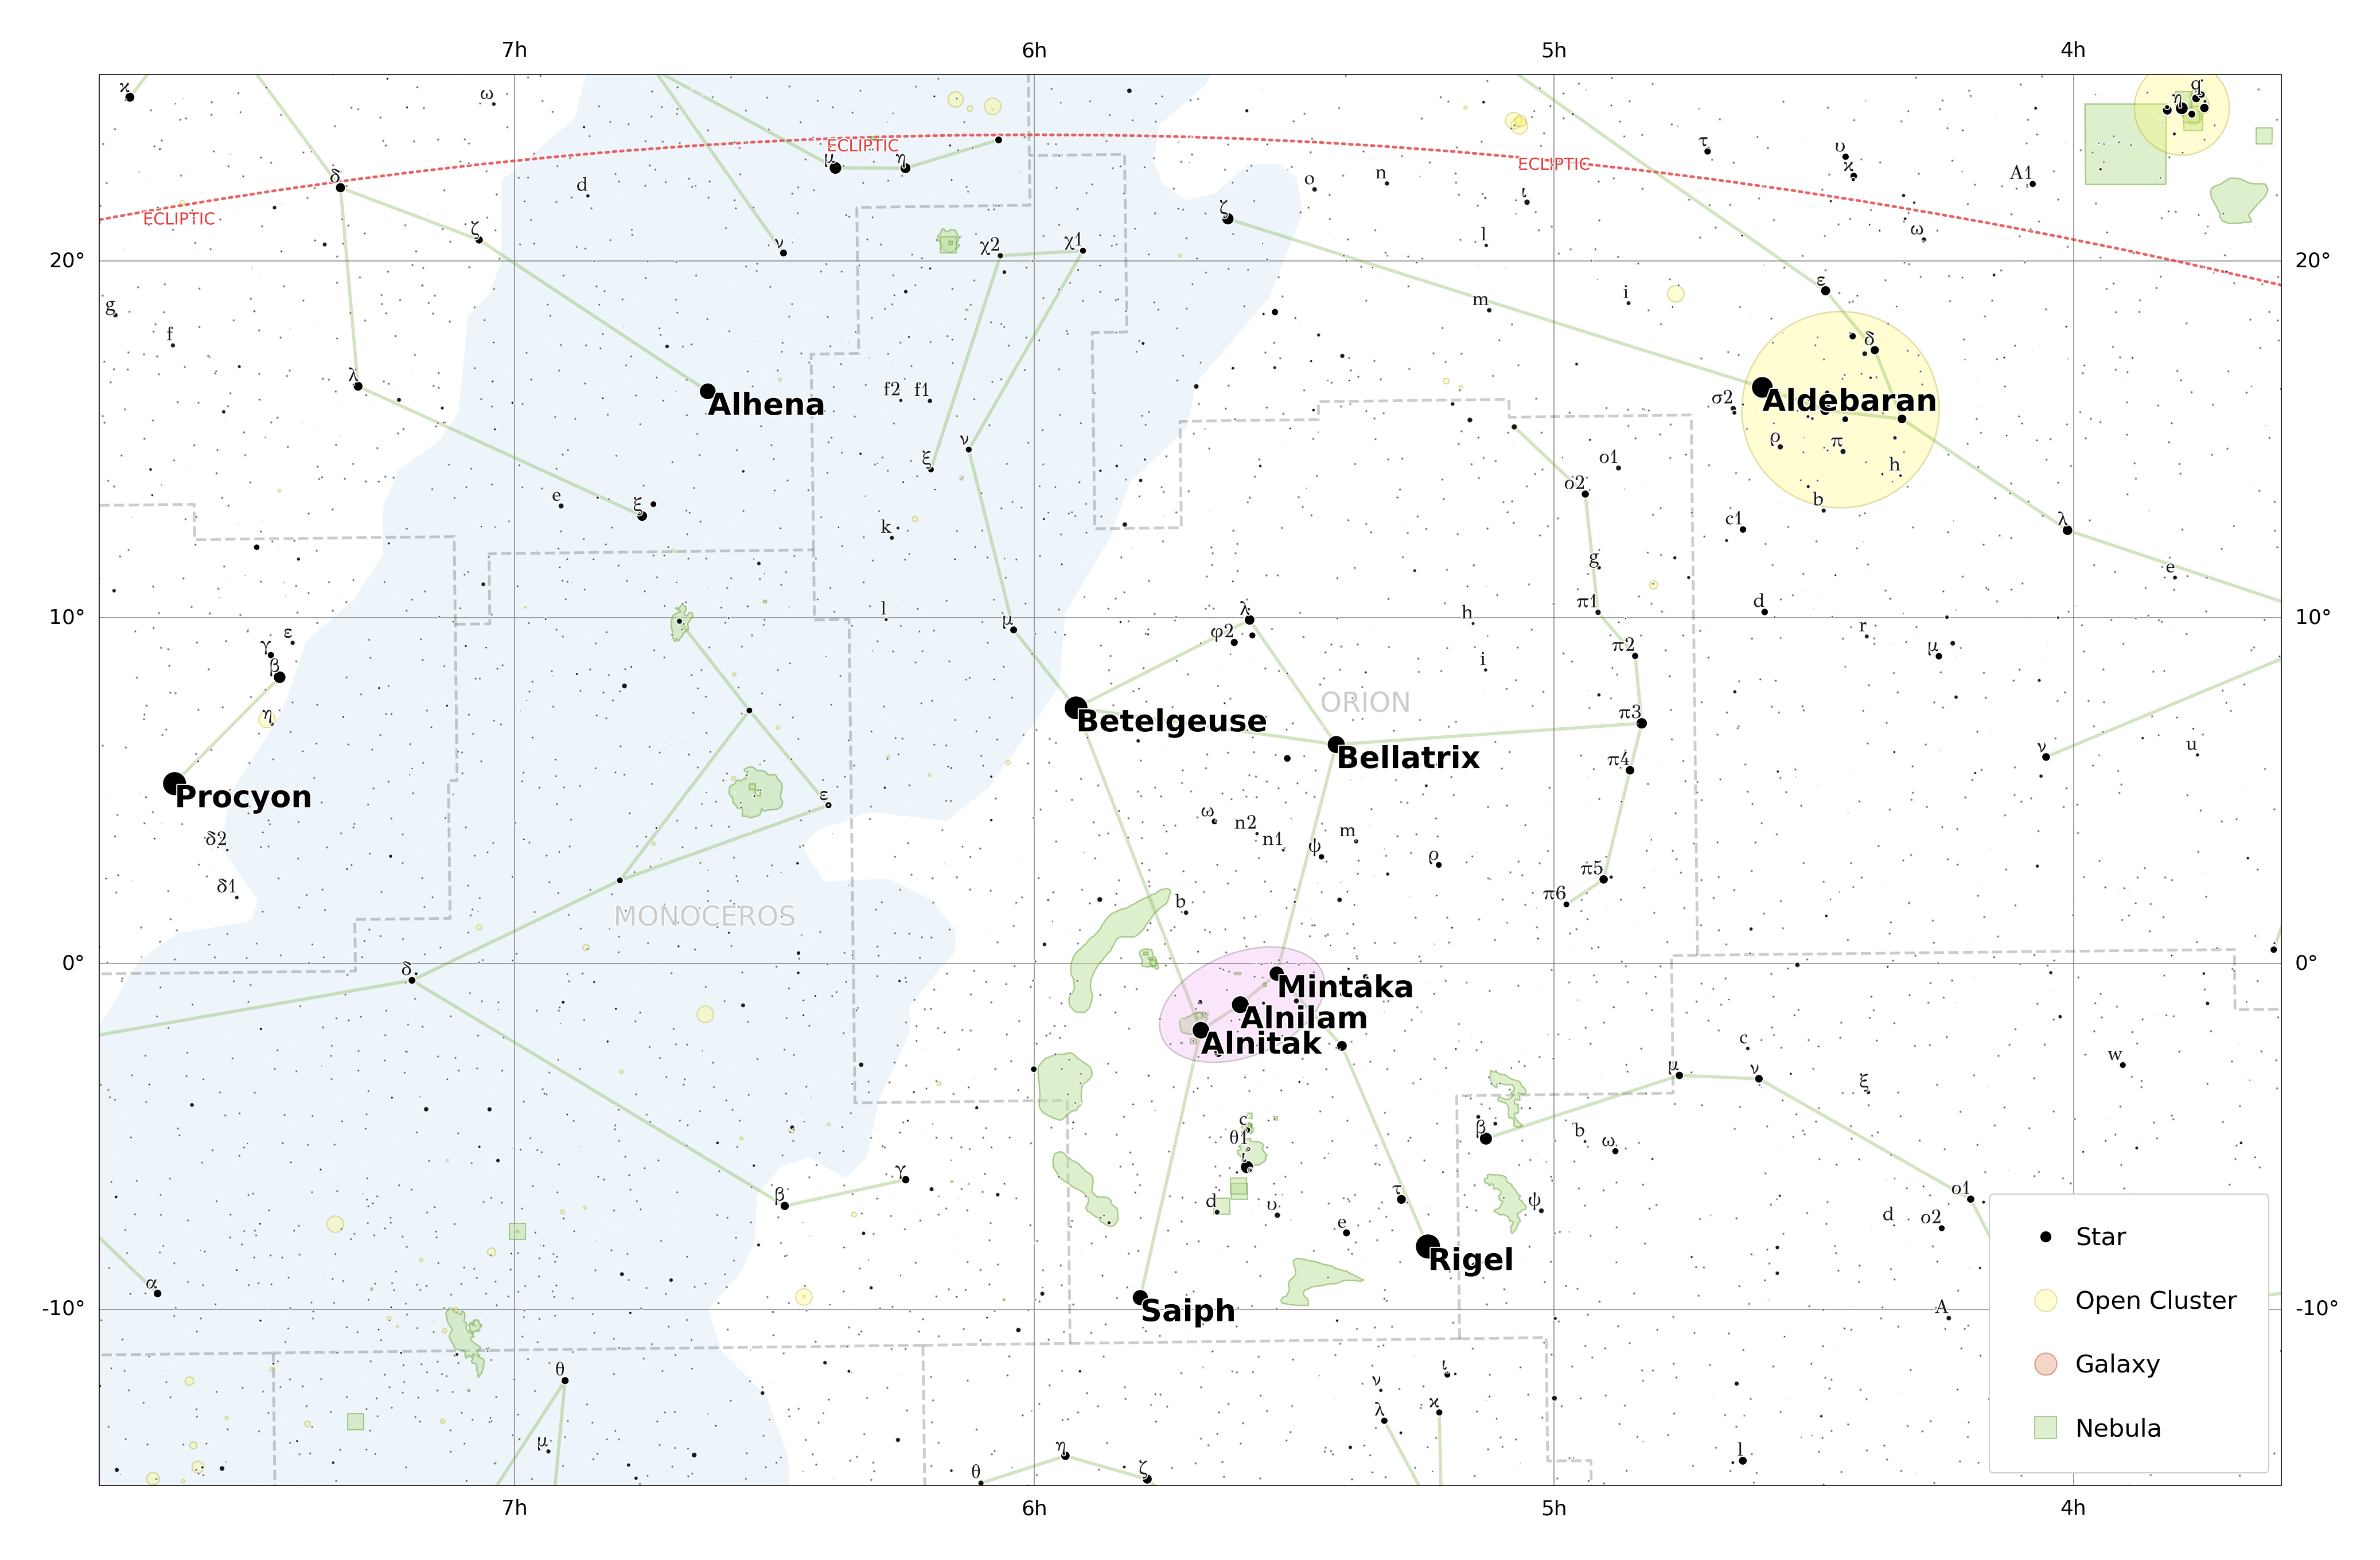
- 🗺️ **Map Plots** - including many map projections
- 🌃 **Horizon Plots** - shows the horizon at a specific time and place
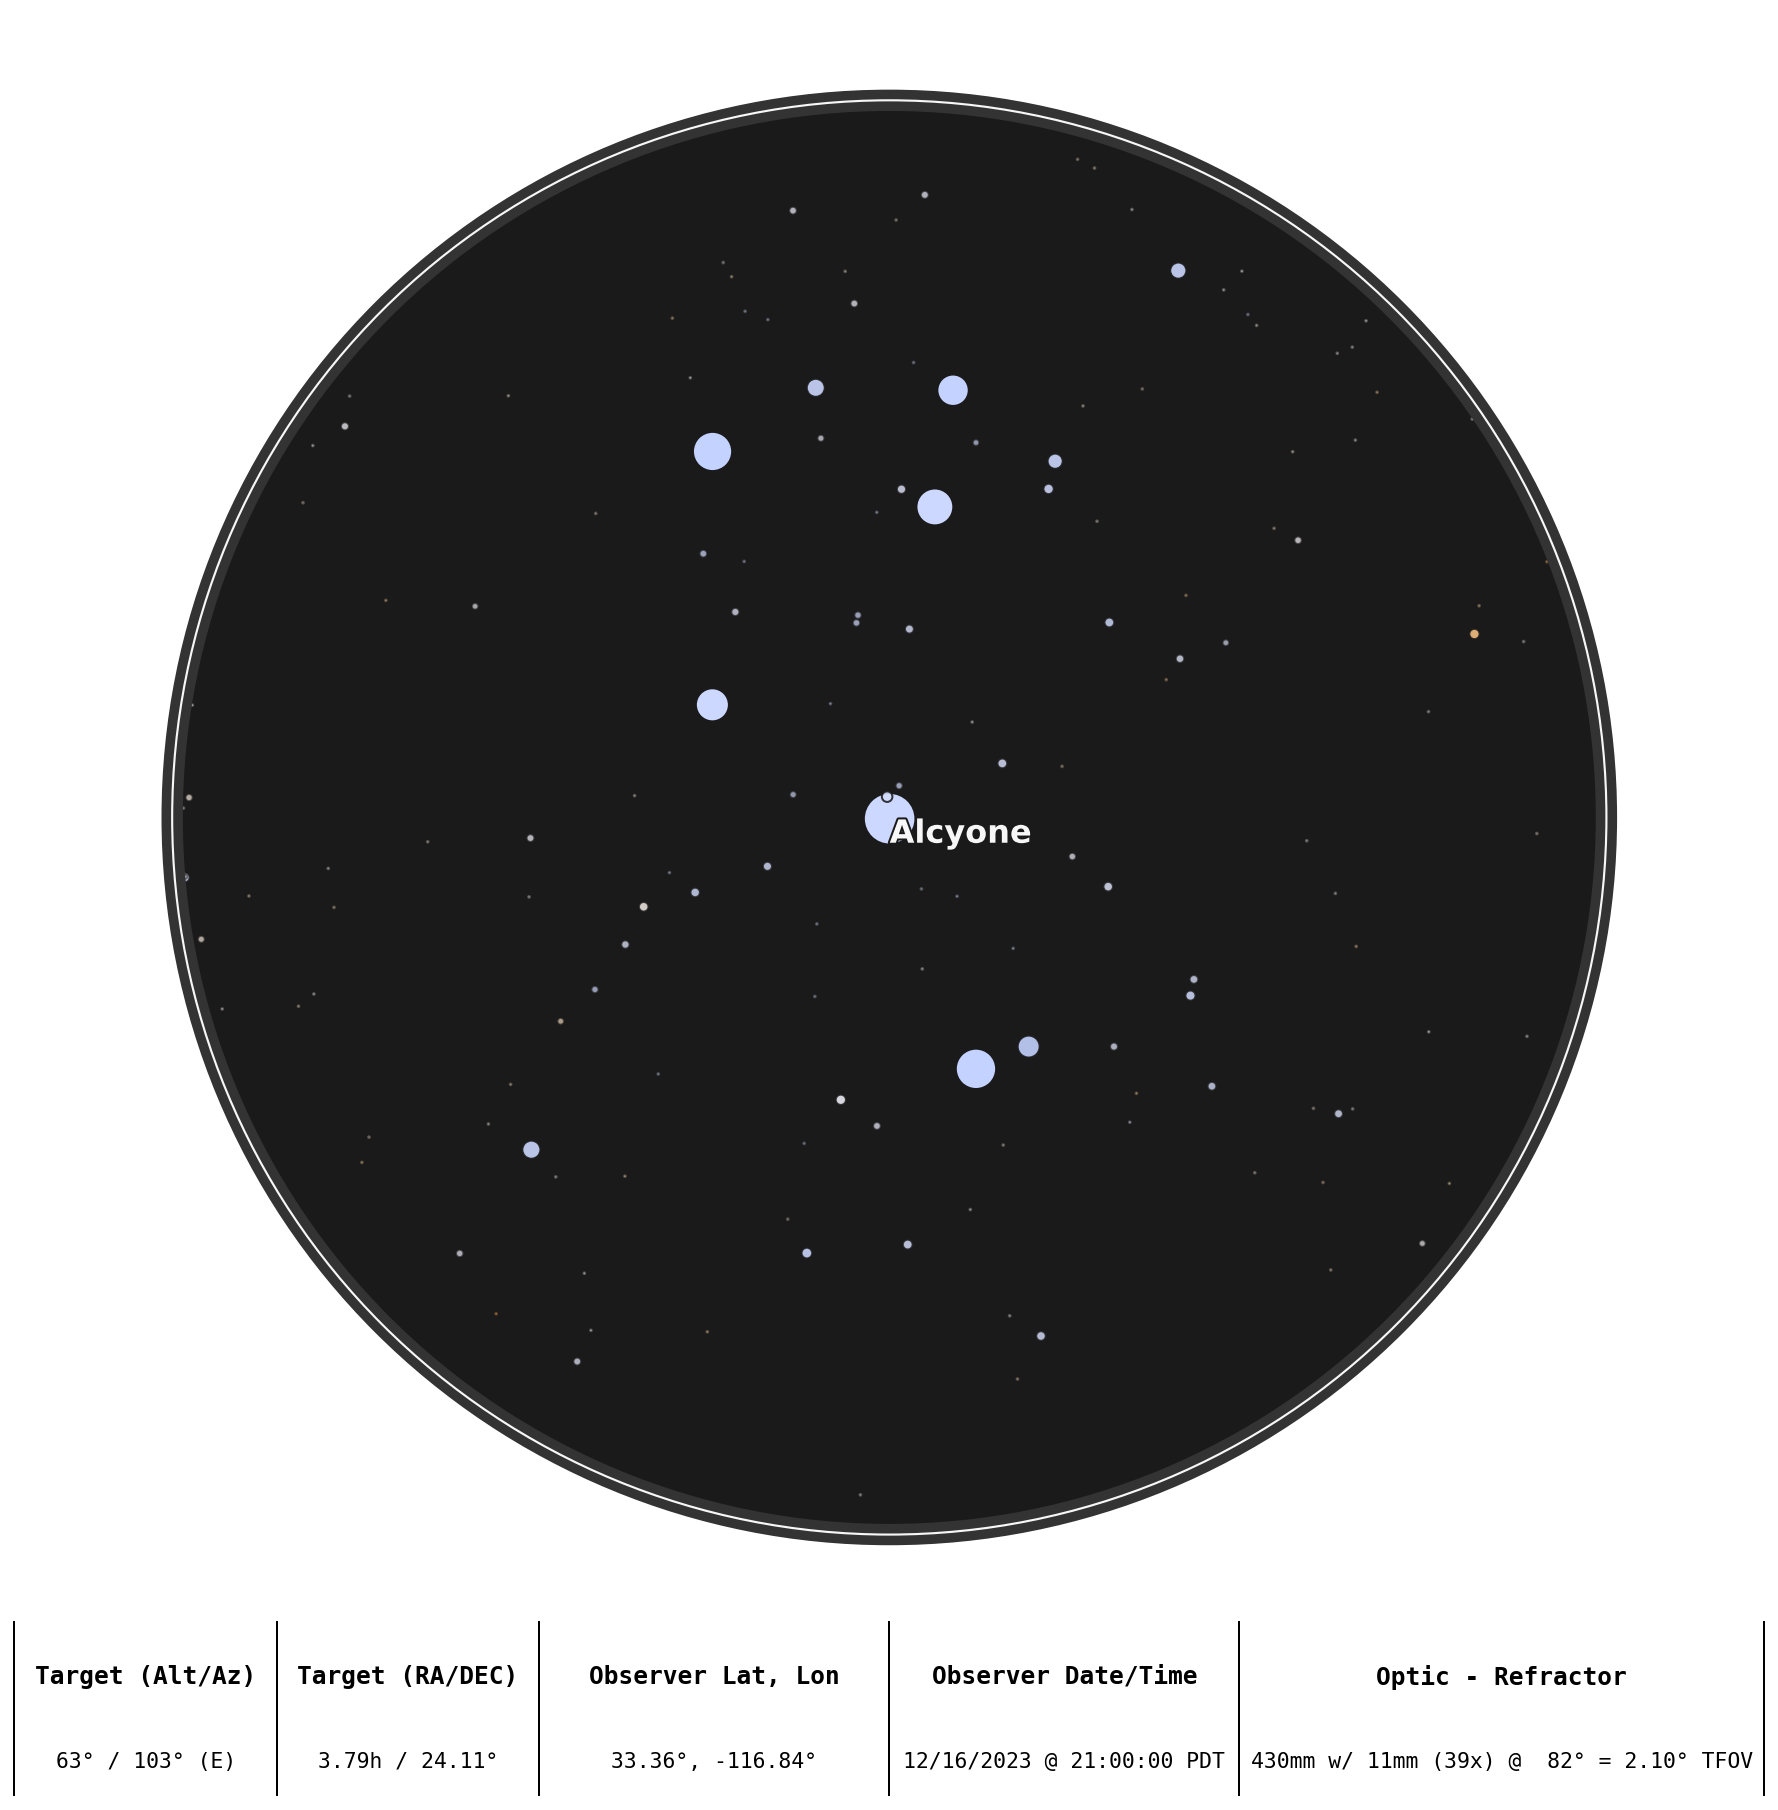
- 🔭 **Optic Plots** - shows what you'll see through an optic (e.g. telescope) at a specific time and place
- 🪐 **Planets and Deep Sky Objects (DSOs)** - more than 14,000 objects built-in
- 🎨 **Custom Styles** - for all objects
- 📥 **Export** - png, svg, jpeg
- 🚀 **Data Backend** - powered by DuckDB + Ibis for fast object lookup
- 🧭 **Label Collision Avoidance**
## Examples
*Zenith plot of the stars from a specific time/location:*
*Map around the constellation Orion:*
*The Pleiades star cluster, as seen through a refractor telescope from a specific time and location:*
## Basic Usage
To create a star chart for tonight's sky as seen from [Palomar Mountain](https://en.wikipedia.org/wiki/Palomar_Mountain) in California:
```python
from datetime import datetime
from zoneinfo import ZoneInfo
from starplot import ZenithPlot, Observer, styles, _
tz = ZoneInfo("America/Los_Angeles")
dt = datetime.now(tz).replace(hour=22)
observer = Observer(
dt=dt,
lat=33.363484,
lon=-116.836394,
)
p = ZenithPlot(
observer=observer,
style=styles.PlotStyle().extend(
styles.extensions.BLUE_MEDIUM,
),
resolution=4096,
autoscale=True,
)
p.constellations()
p.stars(where=[_.magnitude < 4.6])
p.constellation_labels()
p.horizon()
p.export("starchart.png")
```
## Documentation
[https://starplot.dev](https://starplot.dev)
## Demo
For a demo of Starplot's zenith plots, check out:
[Sky Atlas - Star Chart Creator](https://skyatlas.app/star-charts/)
## Discord
Chat with other starplotters on our Discord server:
https://discord.gg/WewJJjshFu
## Contributing
Contributing to Starplot is welcome and very much appreciated! Please see [here](CONTRIBUTING.md) for details.
## Coming Soon
- 🧮 Coordinate system helpers
- 🌑 Planet moons
- ✴️ Custom markers
- ☄️ Comet model
- 😄 🔭 Clear skies
See more details on the [Public Roadmap](https://trello.com/b/sUksygn4/starplot-roadmap)
## License
[MIT License](https://github.com/steveberardi/starplot/blob/main/LICENSE)
Raw data
{
"_id": null,
"home_page": null,
"name": "starplot",
"maintainer": null,
"docs_url": null,
"requires_python": null,
"maintainer_email": null,
"keywords": "astronomy, stars, charts, maps, constellations, sky, plotting",
"author": null,
"author_email": "Steve Berardi <hello@steveberardi.com>",
"download_url": "https://files.pythonhosted.org/packages/0b/bc/4707ad25c681a81fabd2d7574b3222693fb1446c23aee41138646ed9b741/starplot-0.16.2.tar.gz",
"platform": null,
"description": "# <img src=\"https://raw.githubusercontent.com/steveberardi/starplot/main/docs/images/favicon.svg\" width=\"48\" style=\"vertical-align:middle\"> Starplot\n\n\n\n\n\n**Starplot** is a Python library for creating star charts and maps of the sky.\n\n- \u2b50 **Zenith Plots** - shows the entire sky at a specific time and place\n- \ud83d\uddfa\ufe0f **Map Plots** - including many map projections\n- \ud83c\udf03 **Horizon Plots** - shows the horizon at a specific time and place\n- \ud83d\udd2d **Optic Plots** - shows what you'll see through an optic (e.g. telescope) at a specific time and place\n- \ud83e\ude90 **Planets and Deep Sky Objects (DSOs)** - more than 14,000 objects built-in\n- \ud83c\udfa8 **Custom Styles** - for all objects\n- \ud83d\udce5 **Export** - png, svg, jpeg\n- \ud83d\ude80 **Data Backend** - powered by DuckDB + Ibis for fast object lookup\n- \ud83e\udded **Label Collision Avoidance**\n\n## Examples\n*Zenith plot of the stars from a specific time/location:*\n\n\n*Map around the constellation Orion:*\n\n\n*The Pleiades star cluster, as seen through a refractor telescope from a specific time and location:*\n\n\n## Basic Usage\n\nTo create a star chart for tonight's sky as seen from [Palomar Mountain](https://en.wikipedia.org/wiki/Palomar_Mountain) in California:\n\n```python\nfrom datetime import datetime\nfrom zoneinfo import ZoneInfo\n\nfrom starplot import ZenithPlot, Observer, styles, _\n\ntz = ZoneInfo(\"America/Los_Angeles\")\ndt = datetime.now(tz).replace(hour=22)\n\nobserver = Observer(\n dt=dt,\n lat=33.363484,\n lon=-116.836394,\n)\n\np = ZenithPlot(\n observer=observer,\n style=styles.PlotStyle().extend(\n styles.extensions.BLUE_MEDIUM,\n ),\n resolution=4096,\n autoscale=True,\n)\np.constellations()\np.stars(where=[_.magnitude < 4.6])\np.constellation_labels()\np.horizon()\np.export(\"starchart.png\")\n```\n\n## Documentation\n\n[https://starplot.dev](https://starplot.dev)\n\n\n## Demo\nFor a demo of Starplot's zenith plots, check out: \n\n[Sky Atlas - Star Chart Creator](https://skyatlas.app/star-charts/)\n\n## Discord\n\nChat with other starplotters on our Discord server:\n\nhttps://discord.gg/WewJJjshFu\n\n## Contributing\n\nContributing to Starplot is welcome and very much appreciated! Please see [here](CONTRIBUTING.md) for details.\n\n## Coming Soon\n- \ud83e\uddee Coordinate system helpers\n- \ud83c\udf11 Planet moons\n- \u2734\ufe0f Custom markers\n- \u2604\ufe0f Comet model\n- \ud83d\ude04 \ud83d\udd2d Clear skies\n\nSee more details on the [Public Roadmap](https://trello.com/b/sUksygn4/starplot-roadmap)\n\n## License\n[MIT License](https://github.com/steveberardi/starplot/blob/main/LICENSE)\n",
"bugtrack_url": null,
"license": null,
"summary": "Star charts and maps of the sky",
"version": "0.16.2",
"project_urls": {
"Documentation": "https://starplot.dev",
"Home": "https://starplot.dev",
"Source": "https://github.com/steveberardi/starplot"
},
"split_keywords": [
"astronomy",
" stars",
" charts",
" maps",
" constellations",
" sky",
" plotting"
],
"urls": [
{
"comment_text": null,
"digests": {
"blake2b_256": "c2d0b08bd3d2c0c9d7feb37174031f01b4636c9fbb07f1f7b11bd69039433591",
"md5": "91edca7bffd4560e8fa237654215dbfa",
"sha256": "35d92270e0da029c4b69a6d4d189f85e1c4a00f7198d9f04d5158c628449a07e"
},
"downloads": -1,
"filename": "starplot-0.16.2-py2.py3-none-any.whl",
"has_sig": false,
"md5_digest": "91edca7bffd4560e8fa237654215dbfa",
"packagetype": "bdist_wheel",
"python_version": "py2.py3",
"requires_python": null,
"size": 40301846,
"upload_time": "2025-09-07T22:46:23",
"upload_time_iso_8601": "2025-09-07T22:46:23.079662Z",
"url": "https://files.pythonhosted.org/packages/c2/d0/b08bd3d2c0c9d7feb37174031f01b4636c9fbb07f1f7b11bd69039433591/starplot-0.16.2-py2.py3-none-any.whl",
"yanked": false,
"yanked_reason": null
},
{
"comment_text": null,
"digests": {
"blake2b_256": "0bbc4707ad25c681a81fabd2d7574b3222693fb1446c23aee41138646ed9b741",
"md5": "aad9433338ac390128b33c9c7a0691a7",
"sha256": "cbce4aa6abe490fcb1a911c021575ad83b44e3beb0b7ca9e121804285c858000"
},
"downloads": -1,
"filename": "starplot-0.16.2.tar.gz",
"has_sig": false,
"md5_digest": "aad9433338ac390128b33c9c7a0691a7",
"packagetype": "sdist",
"python_version": "source",
"requires_python": null,
"size": 43752293,
"upload_time": "2025-09-07T22:46:26",
"upload_time_iso_8601": "2025-09-07T22:46:26.582004Z",
"url": "https://files.pythonhosted.org/packages/0b/bc/4707ad25c681a81fabd2d7574b3222693fb1446c23aee41138646ed9b741/starplot-0.16.2.tar.gz",
"yanked": false,
"yanked_reason": null
}
],
"upload_time": "2025-09-07 22:46:26",
"github": true,
"gitlab": false,
"bitbucket": false,
"codeberg": false,
"github_user": "steveberardi",
"github_project": "starplot",
"travis_ci": false,
"coveralls": false,
"github_actions": true,
"requirements": [
{
"name": "matplotlib",
"specs": [
[
"==",
"3.10.3"
]
]
},
{
"name": "numpy",
"specs": [
[
"==",
"2.2.6"
]
]
},
{
"name": "pandas",
"specs": [
[
"==",
"2.2.3"
]
]
},
{
"name": "pydantic",
"specs": [
[
"==",
"2.11.7"
]
]
},
{
"name": "pydantic-settings",
"specs": [
[
"==",
"2.10.1"
]
]
},
{
"name": "shapely",
"specs": [
[
"==",
"2.1.1"
]
]
},
{
"name": "skyfield",
"specs": [
[
"==",
"1.53"
]
]
},
{
"name": "cartopy",
"specs": [
[
"==",
"0.25.0"
]
]
},
{
"name": "geopandas",
"specs": [
[
"==",
"1.0.1"
]
]
},
{
"name": "pillow",
"specs": [
[
"==",
"11.0.0"
]
]
},
{
"name": "PyYAML",
"specs": [
[
"==",
"6.0.1"
]
]
},
{
"name": "pyarrow",
"specs": [
[
"==",
"17.0.0"
]
]
},
{
"name": "pyogrio",
"specs": [
[
"==",
"0.10.0"
]
]
},
{
"name": "rtree",
"specs": [
[
"==",
"1.4.1"
]
]
},
{
"name": "requests",
"specs": [
[
"==",
"2.31.0"
]
]
},
{
"name": "duckdb",
"specs": [
[
"==",
"1.3.2"
]
]
},
{
"name": "ibis-framework",
"specs": [
[
"==",
"10.8.0"
]
]
}
],
"lcname": "starplot"
}

