<picture align="center">
<img alt="RamanBiolib logo" style="background:white; padding: 20px;" src="https://raw.githubusercontent.com/mteranm/ramanbiolib-ui/main/ramanbiolibui/img/logo.png">
</picture>
# RamanBiolib UI:
A standalone UI for Biomolecule Identifiaction by means of Raman Spectroscopy using [RamanBiolib](https://github.com/mteranm/ramanbiolib)
## Getting started
### Python package
Installation:
```
pip install ramanbiolib_ui
```
Run:
```
ramanbiolib_ui
```
> **Python version:** Due to the dependency with cefpython3 this library is only compatible with Python 3.7
#### Python 3.7 Installation
##### Windows
Install Python:
- Go to: https://www.python.org/downloads/release/python-379/
- Scroll down to **Files** -> Choose the Windows installer (e.g., Windows x86-64 executable installer)
Install ramanbiolib_ui:
```
py -3.7 -m pip install ramanbiolib_ui
```
Run ramanbiolib_ui:
```
py -3.7 -m ramanbiolibui
```
##### MacOS
Install Python:
- Go to: https://www.python.org/downloads/release/python-379/
- Scroll down to **Files** -> Choose the macOS installer
Install ramanbiolib_ui:
```
python3.7 -m pip install ramanbiolib_ui
```
Run ramanbiolib_ui:
```
python3.7 -m ramanbiolibui
```
##### Linux (Ubuntu/Debian)
Install Python:
```
sudo apt install python3.7
```
Install ramanbiolib_ui:
```
python3.7 -m pip install ramanbiolib_ui
```
Run ramanbiolib_ui:
```
python3.7 -m ramanbiolibui
```
### Windows executable file
You can download the Windows executable (`.exe` file) from the **Releases** section of this repository:
1. Go to the [Releases page](https://github.com/mteranm/ramanbiolib-ui/releases).
2. Find the latest release (or the version you want).
3. Under the **Assets** section, click on the `ramanbiolib-ui.exe` file to download it.
4. Run the downloaded file to start the application.
> **Note**: This executable file is self-signed, so Windows and/or antivirus software may flag it as potentially unsafe. However, the file is secure — it is simply a packaged version of this open-source code created using PyInstaller. If you have any concerns about running the executable, you can always install and run the Python version instead.
#### Run the exe file from CMD/Power Shell
Change to the .exe file download directory:
```
cd C:\Users\<replace-your-userame>\Downloads\
```
Run:
```
.\ramanbiolib-ui.exe
```
## How to use this tool
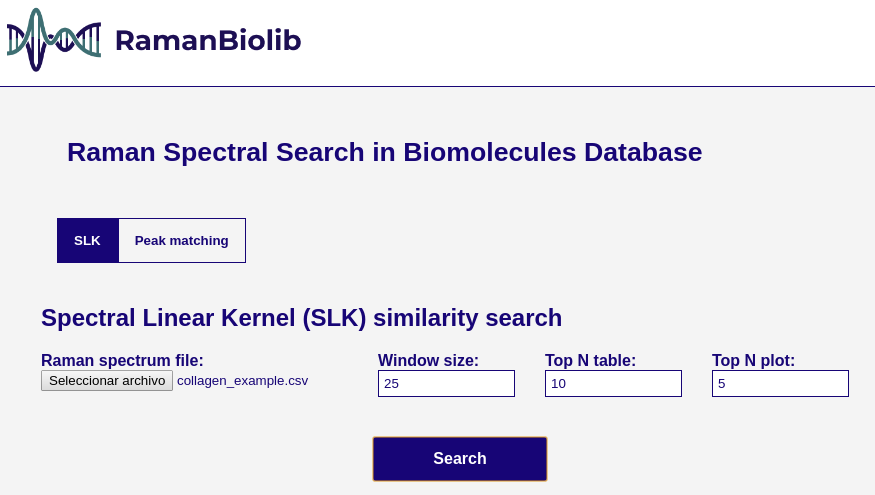
### Spectral Linear Kernel (SLK) similarity search
This uses the full spectra plot to rank the database components by its SLK similarity to the unknown specturm.
Parameters:
- **Raman spectrum file**: the unnknown spectrum file containing the wavenumbers and intensity.
- Accepted formats (column names are not important, but the order):
- CSV (comma-separated) with 2 columns: wavenumbers, intensity
- Renishaw txt (double-tab-separated) with 2 columns: wavenumbers, intensity
- **Window size**: the value of the window (W) parameter in SLK.
- **Top N table**: the number of components to show in the result table.
- **Top N plot**: the number of components to show in the result plot.
The search results display the ranked table of the most similar biomolecules in the RamanBiolib database:
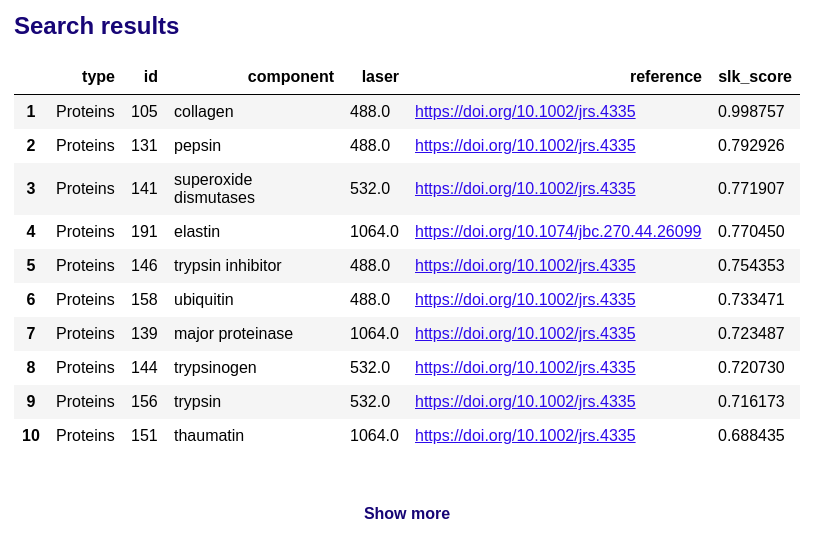
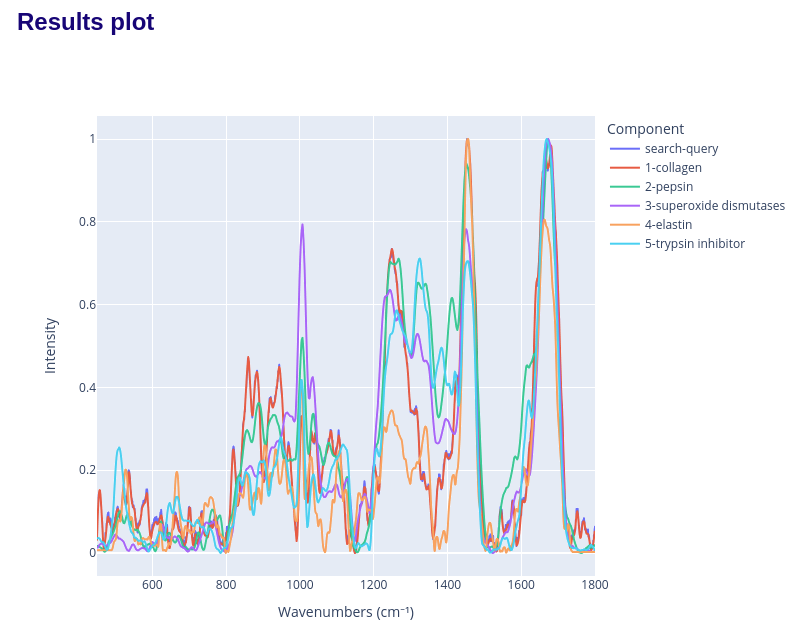
and the spectra comparison plot:
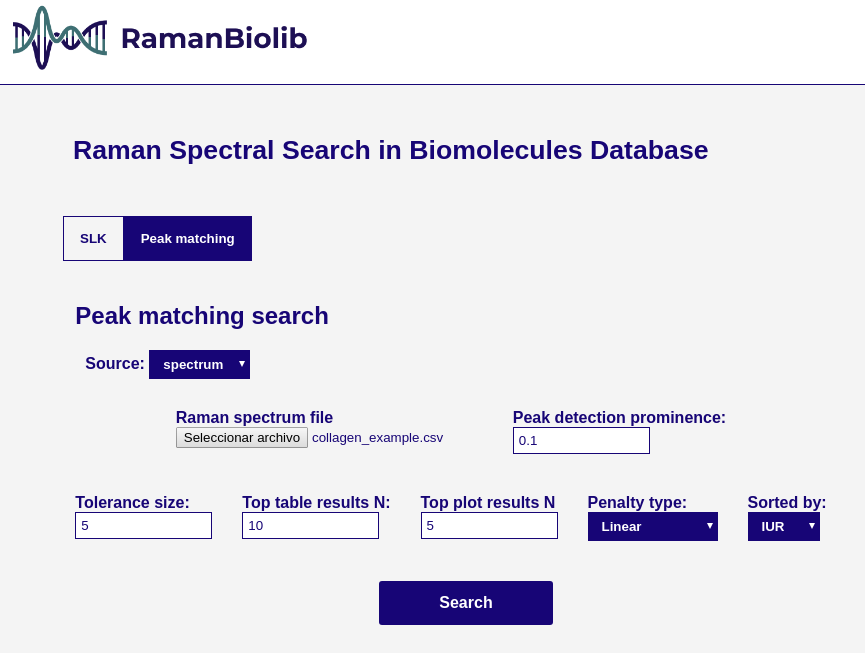
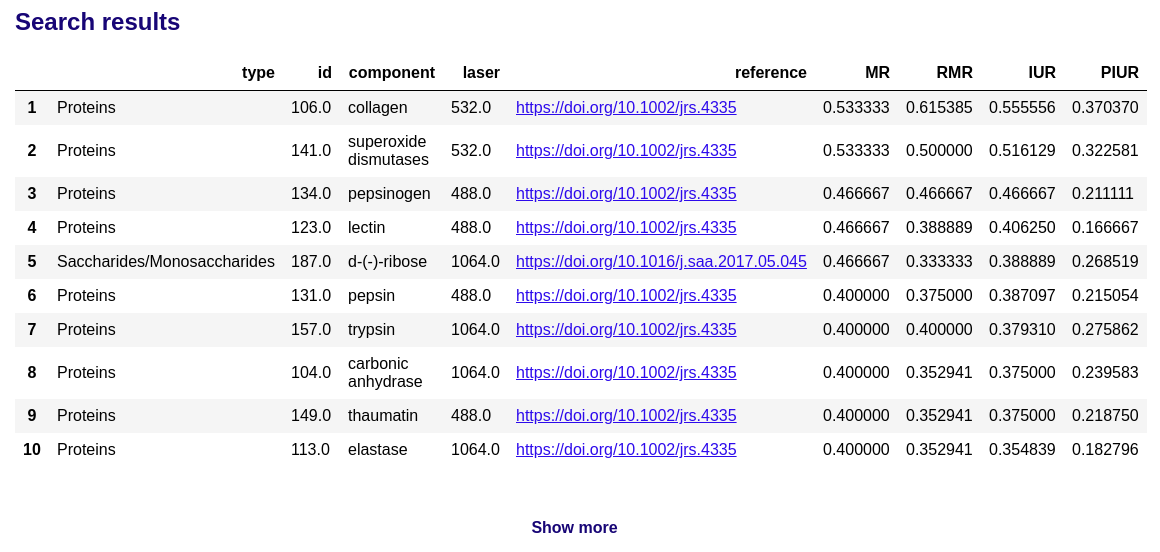
### Peak matching search
This matching calculate the matching between the specturm extracted peak positions and each database component peak positions.
Parameters:
- **Source:**
- **spectrum**: the source is a spectrum file (as in SLK similarity search)
- **Raman spectrum file**: the unnknown spectrum file containing the wavenumbers and intensity.
- Accepted formats (column names are not important, but the order):
- CSV (comma-separated) with 2 columns: wavenumbers, intensity
- Renishaw txt (double-tab-separated) with 2 columns: wavenumbers, intensity
- **Peak detection prominence**: the min prominence threshold for peak detection of the uploaded spectrum once the specturm is min-max normalized. The peak detection is done using scipy find_peaks function.
- **peaks list**:
- **Peaks wavenumbers**: the source is a comma-separated list of peaks wavenumbers positions (cm⁻¹). Example: 100,500,652,1205,1652 (step=1cm⁻¹, min=450, max=1800)
- **Tolerance size**: the simmetrical maximum distance tolerance for peak matching.
- **Penalty type**: the penalty function for PIUR calculation. Linear or Inverse power (1/x).
- **Sorted by**: the metric used to sort the results (IUR, MR, RMR, PIUR). Default IUR.
- Considering query spectrum peaks Pa and DB spectrum peaks Pb:
- MR (Matching Ratio) = intersection(Pa, Pb)/len(Pa)
- RMR (Reverse Matching Ratio) = intersection(Pa, Pb)/len(Pb)
- IUR (Intersection Union Ratio) = intersection(Pa, Pb)/union(Pa, Pb)
- PIUR (Penalized Intersection Union Ratio) = penalized_intersection(Pa, Pb)/union(Pa, Pb)
- **Top N table**: the number of components to show in the result table.
- **Top N plot**: the number of components to show in the result plot.
The search results display the ranked table of the most similar biomolecules in the RamanBiolib database:
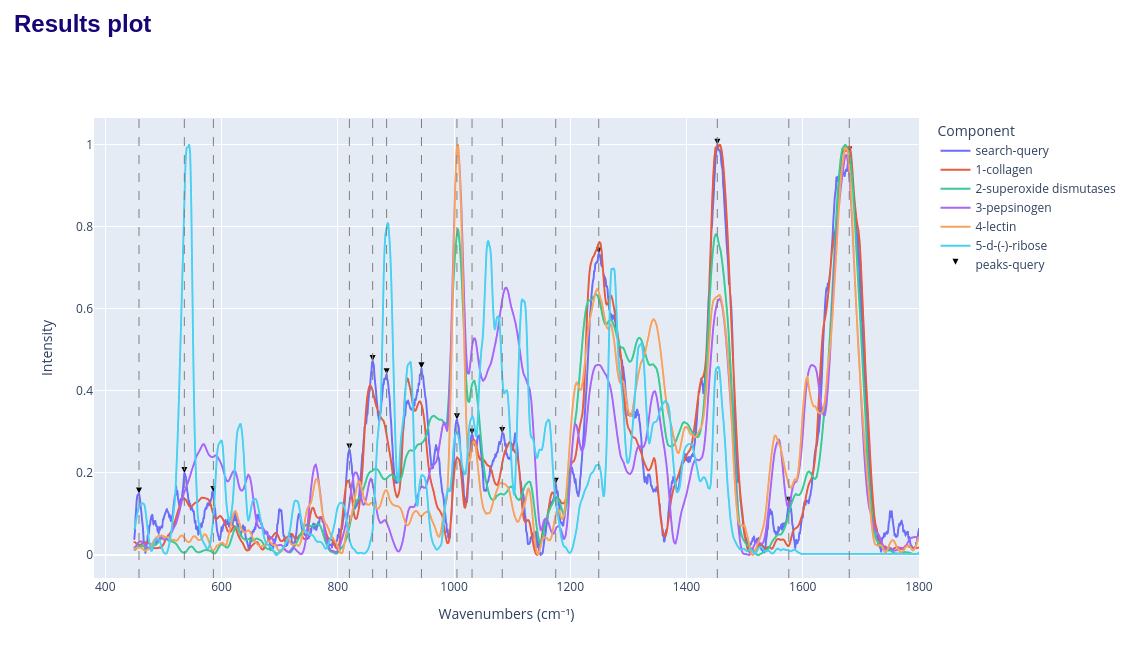
and the spectra comparison plot:
## How to cite this tool
If you use this tool for research, please cite us:
> M Terán, JJ Ruiz, P Loza-Alvarez, D Masip, D Merino, *Open Raman spectral library for biomolecule identification*, Chemometrics and Intelligent Laboratory Systems, Volume 264, 2025, 105476, ISSN 0169-7439, https://doi.org/10.1016/j.chemolab.2025.105476.
## License
[GNU GPL v3](https://raw.githubusercontent.com/mteranm/ramanbiolib-ui/main/LICENSE.txt)
Raw data
{
"_id": null,
"home_page": null,
"name": "ramanbiolib-ui",
"maintainer": null,
"docs_url": null,
"requires_python": "<3.8,>=3.7",
"maintainer_email": null,
"keywords": "raman, spectroscopy, biomolecules",
"author": "Marcelo Teran Miranda",
"author_email": null,
"download_url": "https://files.pythonhosted.org/packages/a0/be/cd53e4201d50ff6c7f797df5e9c2404b826b7d737b55541619ff1d082d0a/ramanbiolib_ui-1.0.0rc5.tar.gz",
"platform": null,
"description": "<picture align=\"center\">\n <img alt=\"RamanBiolib logo\" style=\"background:white; padding: 20px;\" src=\"https://raw.githubusercontent.com/mteranm/ramanbiolib-ui/main/ramanbiolibui/img/logo.png\">\n</picture>\n\n# RamanBiolib UI: \n\nA standalone UI for Biomolecule Identifiaction by means of Raman Spectroscopy using [RamanBiolib](https://github.com/mteranm/ramanbiolib)\n\n## Getting started\n\n### Python package\n\nInstallation:\n\n\n```\npip install ramanbiolib_ui\n```\n\nRun:\n\n```\nramanbiolib_ui\n```\n> **Python version:** Due to the dependency with cefpython3 this library is only compatible with Python 3.7\n\n\n#### Python 3.7 Installation\n\n##### Windows\n\nInstall Python:\n- Go to: https://www.python.org/downloads/release/python-379/\n- Scroll down to **Files** -> Choose the Windows installer (e.g., Windows x86-64 executable installer)\n\nInstall ramanbiolib_ui:\n```\npy -3.7 -m pip install ramanbiolib_ui\n```\nRun ramanbiolib_ui:\n```\npy -3.7 -m ramanbiolibui\n```\n\n##### MacOS\n\nInstall Python:\n- Go to: https://www.python.org/downloads/release/python-379/\n- Scroll down to **Files** -> Choose the macOS installer\n\nInstall ramanbiolib_ui:\n```\npython3.7 -m pip install ramanbiolib_ui\n```\nRun ramanbiolib_ui:\n```\npython3.7 -m ramanbiolibui\n```\n\n##### Linux (Ubuntu/Debian)\n\nInstall Python:\n```\nsudo apt install python3.7\n```\n\nInstall ramanbiolib_ui:\n```\npython3.7 -m pip install ramanbiolib_ui\n```\nRun ramanbiolib_ui:\n```\npython3.7 -m ramanbiolibui\n```\n\n### Windows executable file\n\nYou can download the Windows executable (`.exe` file) from the **Releases** section of this repository:\n\n1. Go to the [Releases page](https://github.com/mteranm/ramanbiolib-ui/releases).\n2. Find the latest release (or the version you want).\n3. Under the **Assets** section, click on the `ramanbiolib-ui.exe` file to download it.\n4. Run the downloaded file to start the application.\n\n> **Note**: This executable file is self-signed, so Windows and/or antivirus software may flag it as potentially unsafe. However, the file is secure \u2014 it is simply a packaged version of this open-source code created using PyInstaller. If you have any concerns about running the executable, you can always install and run the Python version instead.\n\n#### Run the exe file from CMD/Power Shell\n\nChange to the .exe file download directory:\n```\ncd C:\\Users\\<replace-your-userame>\\Downloads\\\n```\nRun:\n```\n.\\ramanbiolib-ui.exe\n```\n\n## How to use this tool\n\n### Spectral Linear Kernel (SLK) similarity search\n\nThis uses the full spectra plot to rank the database components by its SLK similarity to the unknown specturm.\n\nParameters:\n- **Raman spectrum file**: the unnknown spectrum file containing the wavenumbers and intensity.\n - Accepted formats (column names are not important, but the order):\n - CSV (comma-separated) with 2 columns: wavenumbers, intensity\n - Renishaw txt (double-tab-separated) with 2 columns: wavenumbers, intensity\n- **Window size**: the value of the window (W) parameter in SLK.\n- **Top N table**: the number of components to show in the result table.\n- **Top N plot**: the number of components to show in the result plot.\n\n\n\n\nThe search results display the ranked table of the most similar biomolecules in the RamanBiolib database:\n\n\n\n\nand the spectra comparison plot:\n\n\n\n\n### Peak matching search\n\nThis matching calculate the matching between the specturm extracted peak positions and each database component peak positions.\n\nParameters:\n\n- **Source:**\n - **spectrum**: the source is a spectrum file (as in SLK similarity search)\n - **Raman spectrum file**: the unnknown spectrum file containing the wavenumbers and intensity.\n - Accepted formats (column names are not important, but the order):\n - CSV (comma-separated) with 2 columns: wavenumbers, intensity\n - Renishaw txt (double-tab-separated) with 2 columns: wavenumbers, intensity\n - **Peak detection prominence**: the min prominence threshold for peak detection of the uploaded spectrum once the specturm is min-max normalized. The peak detection is done using scipy find_peaks function.\n - **peaks list**: \n - **Peaks wavenumbers**: the source is a comma-separated list of peaks wavenumbers positions (cm\u207b\u00b9). Example: 100,500,652,1205,1652 (step=1cm\u207b\u00b9, min=450, max=1800)\n- **Tolerance size**: the simmetrical maximum distance tolerance for peak matching.\n- **Penalty type**: the penalty function for PIUR calculation. Linear or Inverse power (1/x).\n- **Sorted by**: the metric used to sort the results (IUR, MR, RMR, PIUR). Default IUR. \n - Considering query spectrum peaks Pa and DB spectrum peaks Pb: \n - MR (Matching Ratio) = intersection(Pa, Pb)/len(Pa) \n - RMR (Reverse Matching Ratio) = intersection(Pa, Pb)/len(Pb) \n - IUR (Intersection Union Ratio) = intersection(Pa, Pb)/union(Pa, Pb) \n - PIUR (Penalized Intersection Union Ratio) = penalized_intersection(Pa, Pb)/union(Pa, Pb) \n- **Top N table**: the number of components to show in the result table.\n- **Top N plot**: the number of components to show in the result plot.\n\n\n\n\nThe search results display the ranked table of the most similar biomolecules in the RamanBiolib database:\n\n\n\n\nand the spectra comparison plot:\n\n\n\n\n## How to cite this tool\n\nIf you use this tool for research, please cite us:\n\n> M Ter\u00e1n, JJ Ruiz, P Loza-Alvarez, D Masip, D Merino, *Open Raman spectral library for biomolecule identification*, Chemometrics and Intelligent Laboratory Systems, Volume 264, 2025, 105476, ISSN 0169-7439, https://doi.org/10.1016/j.chemolab.2025.105476.\n\n## License\n\n[GNU GPL v3](https://raw.githubusercontent.com/mteranm/ramanbiolib-ui/main/LICENSE.txt)\n",
"bugtrack_url": null,
"license": "GNU GPLv3",
"summary": "UI for ramanbiolib. Biomolecules identification search using Raman spectra.",
"version": "1.0.0rc5",
"project_urls": {
"Homepage": "https://github.com/mteranm/ramanbiolib-ui",
"Repository": "https://github.com/mteranm/ramanbiolib-ui"
},
"split_keywords": [
"raman",
" spectroscopy",
" biomolecules"
],
"urls": [
{
"comment_text": null,
"digests": {
"blake2b_256": "3c1c4fff27d3e485160c89f25c437a050a66c37739558a1464916170f62d2762",
"md5": "3d678e4cd440886886676be2ae8f793b",
"sha256": "08270febc72ef2d3da7ae7d2d1588fcd9972b80d4556efaaba0374ea5c89b037"
},
"downloads": -1,
"filename": "ramanbiolib_ui-1.0.0rc5-py3-none-any.whl",
"has_sig": false,
"md5_digest": "3d678e4cd440886886676be2ae8f793b",
"packagetype": "bdist_wheel",
"python_version": "py3",
"requires_python": "<3.8,>=3.7",
"size": 164777,
"upload_time": "2025-07-16T22:33:18",
"upload_time_iso_8601": "2025-07-16T22:33:18.686203Z",
"url": "https://files.pythonhosted.org/packages/3c/1c/4fff27d3e485160c89f25c437a050a66c37739558a1464916170f62d2762/ramanbiolib_ui-1.0.0rc5-py3-none-any.whl",
"yanked": false,
"yanked_reason": null
},
{
"comment_text": null,
"digests": {
"blake2b_256": "a0becd53e4201d50ff6c7f797df5e9c2404b826b7d737b55541619ff1d082d0a",
"md5": "f26fef29cd4776b699c59a0e357538f4",
"sha256": "9fab76d49b3d83d8ae2c535bcce0cd764eeda59e0483c9628699472d559d95bb"
},
"downloads": -1,
"filename": "ramanbiolib_ui-1.0.0rc5.tar.gz",
"has_sig": false,
"md5_digest": "f26fef29cd4776b699c59a0e357538f4",
"packagetype": "sdist",
"python_version": "source",
"requires_python": "<3.8,>=3.7",
"size": 827028,
"upload_time": "2025-07-16T22:33:20",
"upload_time_iso_8601": "2025-07-16T22:33:20.149221Z",
"url": "https://files.pythonhosted.org/packages/a0/be/cd53e4201d50ff6c7f797df5e9c2404b826b7d737b55541619ff1d082d0a/ramanbiolib_ui-1.0.0rc5.tar.gz",
"yanked": false,
"yanked_reason": null
}
],
"upload_time": "2025-07-16 22:33:20",
"github": true,
"gitlab": false,
"bitbucket": false,
"codeberg": false,
"github_user": "mteranm",
"github_project": "ramanbiolib-ui",
"travis_ci": false,
"coveralls": false,
"github_actions": true,
"requirements": [
{
"name": "cefpython3",
"specs": [
[
"==",
"66.0"
]
]
},
{
"name": "numpy",
"specs": [
[
"<",
"1.22"
],
[
">=",
"1.21.6"
]
]
},
{
"name": "pandas",
"specs": [
[
">=",
"1.1.5"
],
[
"<",
"2.0"
]
]
},
{
"name": "scipy",
"specs": [
[
"<",
"1.8"
],
[
">=",
"1.7.3"
]
]
},
{
"name": "plotly",
"specs": [
[
"<",
"6.0"
],
[
">=",
"5.0"
]
]
},
{
"name": "ramanbiolib",
"specs": []
}
],
"lcname": "ramanbiolib-ui"
}

