# Data Science Utils: Frequently Used Methods for Data Science
[](https://opensource.org/licenses/MIT)

[](https://github.com/idanmoradarthas/DataScienceUtils/issues)
[](https://datascienceutils.readthedocs.io/en/latest/?badge=latest)


[](https://badge.fury.io/py/data-science-utils)
[](https://anaconda.org/idanmorad/data-science-utils)

[](https://coveralls.io/github/idanmoradarthas/DataScienceUtils?branch=master)
Data Science Utils extends the Scikit-Learn API and Matplotlib API to provide simple methods that simplify tasks and
visualizations for data science projects.
# Code Examples and Documentation
**Let's explore some code examples and outputs.**
**You can find the full documentation with all the code examples at:
[https://datascienceutils.readthedocs.io/en/stable/](https://datascienceutils.readthedocs.io/en/stable/)**
In the documentation, you can find more methods and additional examples.
The API of the package is built to work with the Scikit-Learn API and Matplotlib API. Here are some of the capabilities
of this
package:
## Metrics
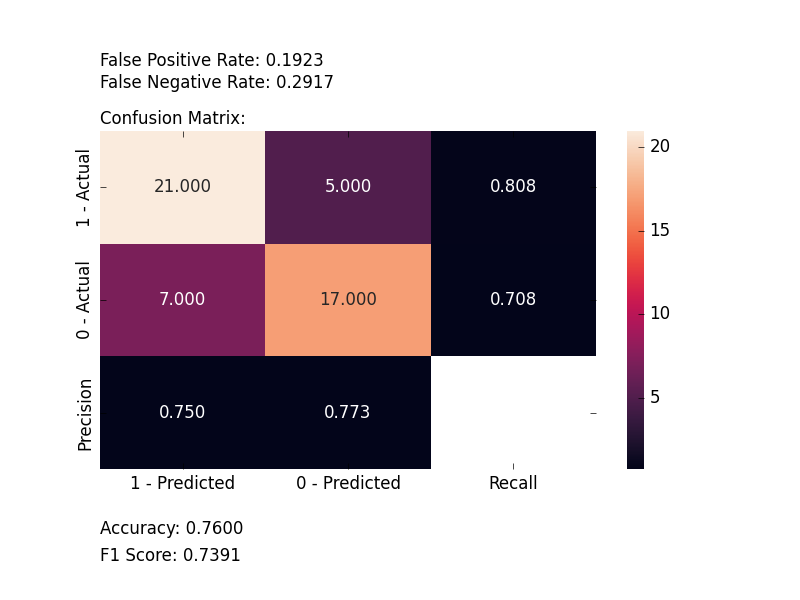
### Plot Confusion Matrix
Computes and plots a confusion matrix, False Positive Rate, False Negative Rate, Accuracy, and F1 score of a
classification.
```python
from ds_utils.metrics import plot_confusion_matrix
plot_confusion_matrix(y_test, y_pred, [0, 1, 2])
```
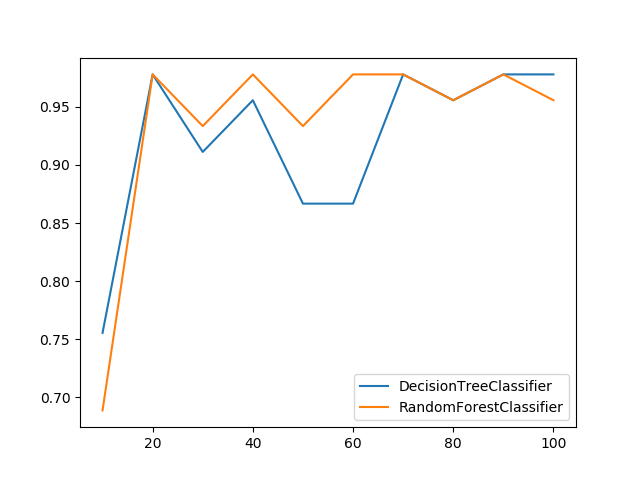
### Plot Metric Growth per Labeled Instances
Receives train and test sets, and plots the given metric change with an increasing number of trained instances.
```python
from ds_utils.metrics import plot_metric_growth_per_labeled_instances
from sklearn.tree import DecisionTreeClassifier
from sklearn.ensemble import RandomForestClassifier
plot_metric_growth_per_labeled_instances(
x_train, y_train, x_test, y_test,
{
"DecisionTreeClassifier": DecisionTreeClassifier(random_state=0),
"RandomForestClassifier": RandomForestClassifier(random_state=0, n_estimators=5)
}
)
```
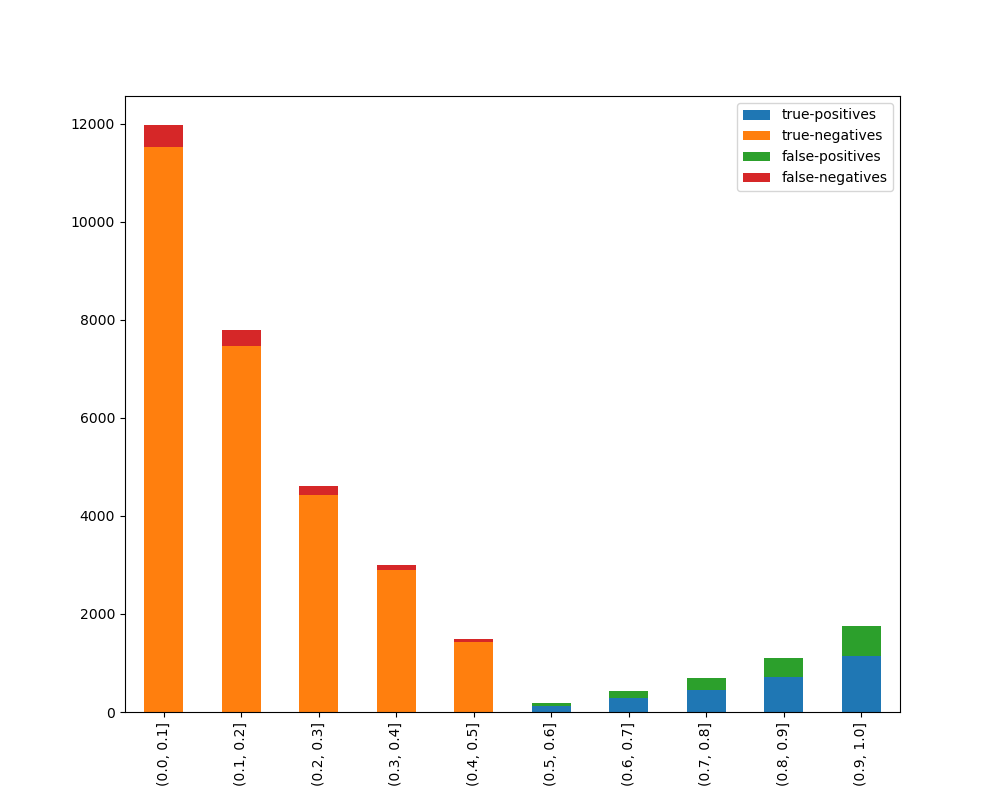
### Visualize Accuracy Grouped by Probability
Receives test true labels and classifier probability predictions, divides and classifies the results, and finally
plots a stacked bar chart with the results. [Original code](https://github.com/EthicalML/XAI)
```python
from ds_utils.metrics import visualize_accuracy_grouped_by_probability
visualize_accuracy_grouped_by_probability(
test["target"],
1,
classifier.predict_proba(test[selected_features]),
display_breakdown=False
)
```
Without breakdown:

With breakdown:
### Receiver Operating Characteristic (ROC) Curve with Probabilities (Thresholds) Annotations
Plot ROC curves with threshold annotations for multiple classifiers, using plotly as a backend.
```python
from ds_utils.metrics import plot_roc_curve_with_thresholds_annotations
classifiers_names_and_scores_dict = {
"Decision Tree": tree_clf.predict_proba(X_test)[:, 1],
"Random Forest": rf_clf.predict_proba(X_test)[:, 1],
"XGBoost": xgb_clf.predict_proba(X_test)[:, 1]
}
fig = plot_roc_curve_with_thresholds_annotations(
y_true,
classifiers_names_and_scores_dict,
positive_label=1
)
fig.show()
```

### Precision-Recall Curve with Probabilities (Thresholds) Annotations
Plot Precision-Recall curves with threshold annotations for multiple classifiers, using plotly as a backend.
```python
from ds_utils.metrics import plot_precision_recall_curve_with_thresholds_annotations
classifiers_names_and_scores_dict = {
"Decision Tree": tree_clf.predict_proba(X_test)[:, 1],
"Random Forest": rf_clf.predict_proba(X_test)[:, 1],
"XGBoost": xgb_clf.predict_proba(X_test)[:, 1]
}
fig = plot_precision_recall_curve_with_thresholds_annotations(
y_true,
classifiers_names_and_scores_dict,
positive_label=1
)
fig.show()
```

## Preprocess
### Visualize Feature
Receives a feature and visualizes its values on a graph:
* If the feature is float, the method plots the distribution plot.
* If the feature is datetime, the method plots a line plot of progression over time.
* If the feature is object, categorical, boolean, or integer, the method plots a count plot (histogram).
```python
from ds_utils.preprocess import visualize_feature
visualize_feature(X_train["feature"])
```
| Feature Type | Plot |
|-------------------|----------------------------------------------------------------------------------------------------------------------------------------------------------------------------------|
| Float | 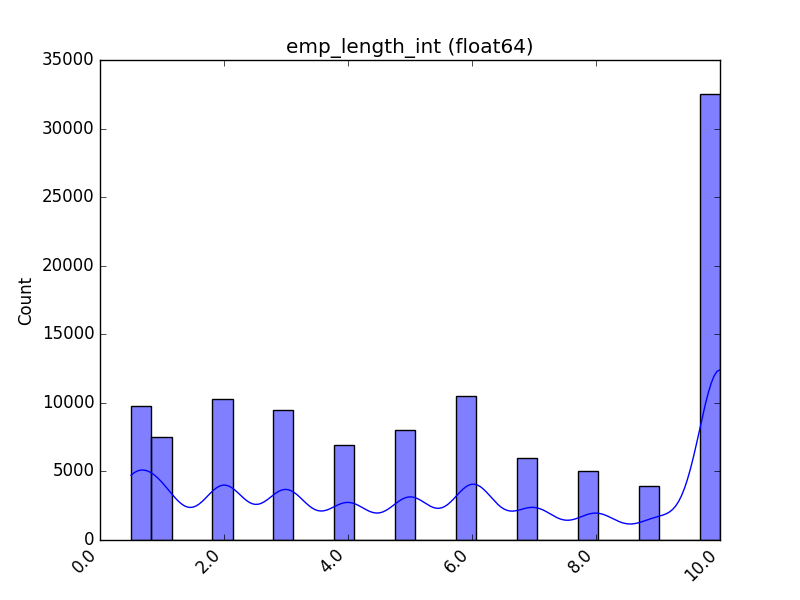 |
| Integer | 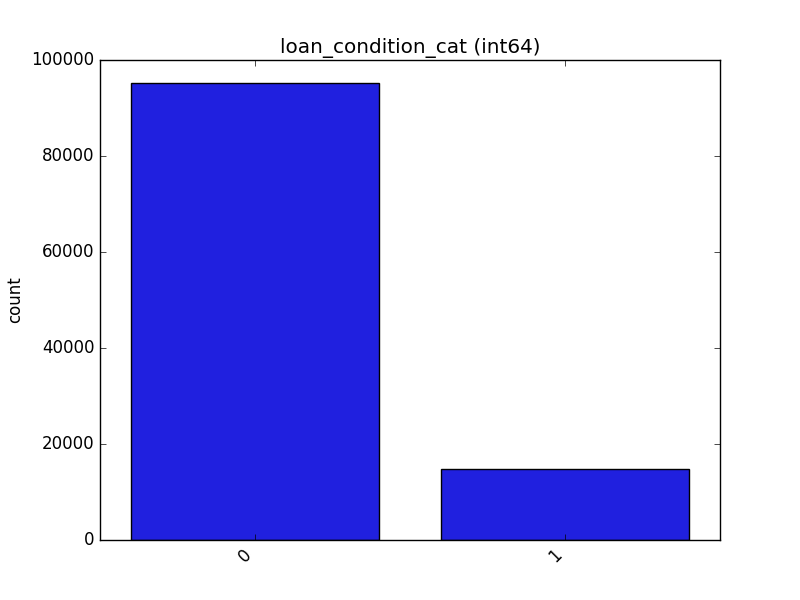 |
| Datetime | 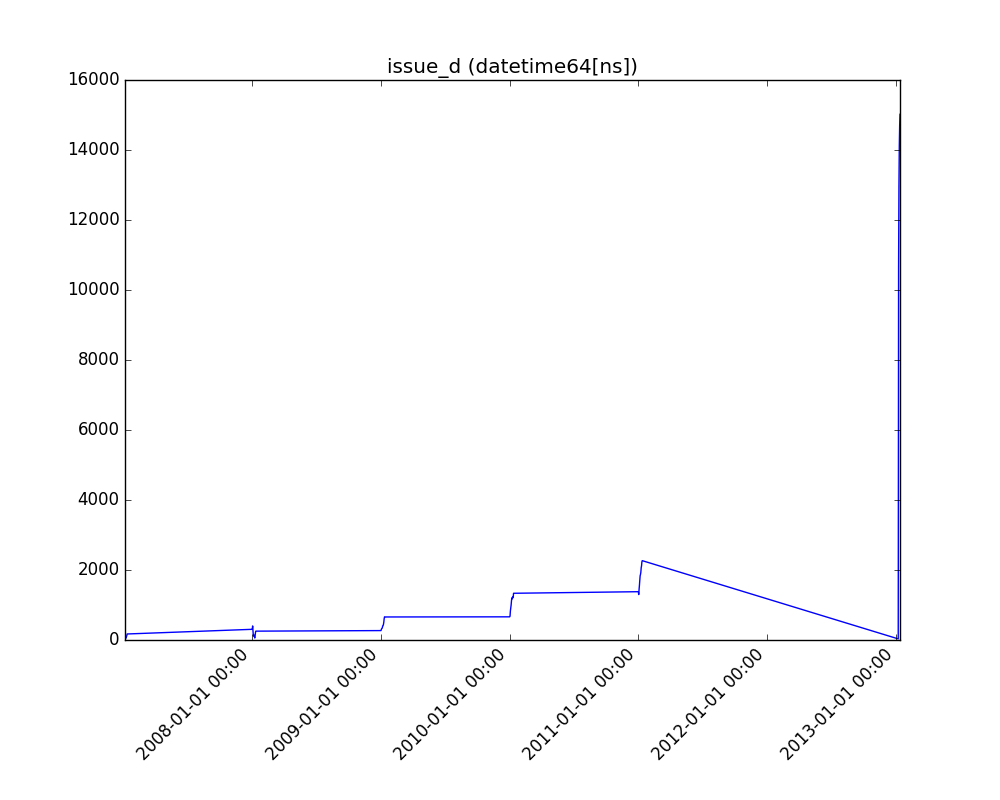 |
| Category / Object |  |
| Boolean | 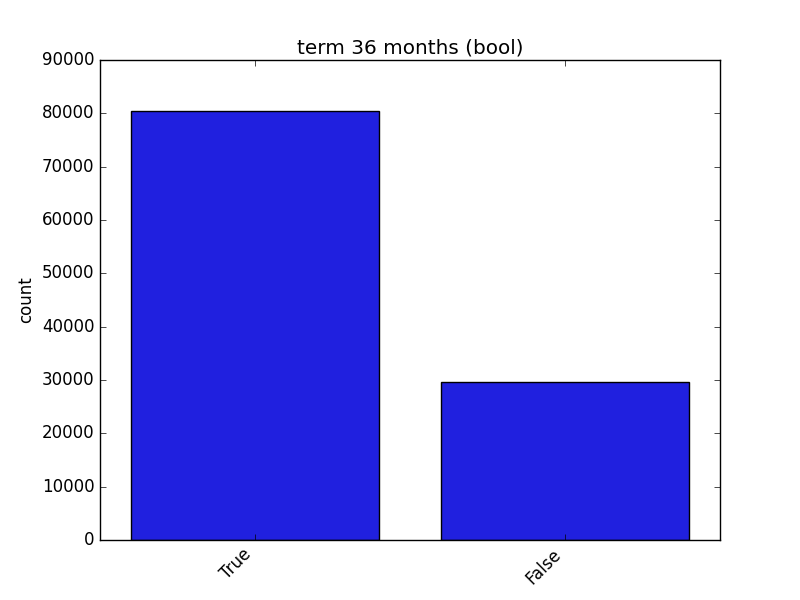 |
### Get Correlated Features
Calculate which features are correlated above a threshold and extract a data frame with the correlations and correlation
to the target feature.
```python
from ds_utils.preprocess import get_correlated_features
correlations = get_correlated_features(correlation_matrix, features, target)
```
| level_0 | level_1 | level_0_level_1_corr | level_0_target_corr | level_1_target_corr |
|------------------------|------------------------|----------------------|---------------------|---------------------|
| income_category_Low | income_category_Medium | 1.0 | 0.1182165609358650 | 0.11821656093586504 |
| term\_ 36 months | term\_ 60 months | 1.0 | 0.1182165609358650 | 0.11821656093586504 |
| interest_payments_High | interest_payments_Low | 1.0 | 0.1182165609358650 | 0.11821656093586504 |
### Visualize Correlations
Compute pairwise correlation of columns, excluding NA/null values, and visualize it with a heat map.
[Original code](https://seaborn.pydata.org/examples/many_pairwise_correlations.html)
```python
from ds_utils.preprocess import visualize_correlations
visualize_correlations(correlation_matrix)
```

### Plot Correlation Dendrogram
Plot a dendrogram of a correlation matrix. This consists of a chart that shows hierarchically the variables that are
most correlated by connecting trees. The closer to the right that the connection is, the more correlated the
features are. [Original code](https://github.com/EthicalML/XAI)
```python
from ds_utils.preprocess import plot_correlation_dendrogram
plot_correlation_dendrogram(correlation_matrix)
```

### Plot Features' Interaction
Plots the joint distribution between two features:
* If both features are either categorical, boolean, or object, the method plots the shared histogram.
* If one feature is either categorical, boolean, or object and the other is numeric, the method plots a boxplot chart.
* If one feature is datetime and the other is numeric or datetime, the method plots a line plot graph.
* If one feature is datetime and the other is either categorical, boolean, or object, the method plots a violin plot (
combination of boxplot and kernel density estimate).
* If both features are numeric, the method plots a scatter graph.
```python
from ds_utils.preprocess import plot_features_interaction
plot_features_interaction(data, "feature_1", "feature_2")
```
| | Numeric | Categorical | Boolean | Datetime |
|-----------------|--------------------------------------------------------------------------------------------------------------------------------------------------------------------------------------|---------------------------------------------------------------------------------------------------------------------------------------------------------------------------------------|----------------------------------------------------------------------------------------------------------------------------------------------------------------------------------------|------------------------------------------------------------------------------------------------------------------------------------------------------------------------------------|
| **Numeric** |  | | | |
| **Categorical** |  |  | | |
| **Boolean** |  |  |  | |
| **Datetime** |  |  |  |  |
### Extract Statistics DataFrame per Label
This method calculates comprehensive statistical metrics for numerical features grouped by label values. Use this when
you want to:
- Analyze how a numerical feature's distribution varies across different categories
- Detect potential patterns or anomalies in feature behavior per group
- Generate detailed statistical summaries for reporting or analysis
- Understand the relationship between features and target variables
```python
from ds_utils.preprocess import extract_statistics_dataframe_per_label
extract_statistics_dataframe_per_label(
df=df,
feature_name='amount',
label_name='category'
)
```
| category | count | null_count | mean | min | 1_percentile | 5_percentile | 25_percentile | median | 75_percentile | 95_percentile | 99_percentile | max |
|----------|-------|------------|-------|-----|--------------|--------------|---------------|--------|---------------|---------------|---------------|-------|
| A | 2 | 0 | 150.0 | 100 | 100.0 | 100.0 | 100.0 | 150.0 | 200.0 | 200.0 | 200.0 | 200.0 |
| B | 2 | 0 | 225.0 | 150 | 150.0 | 150.0 | 150.0 | 225.0 | 300.0 | 300.0 | 300.0 | 300.0 |
| C | 2 | 0 | 212.5 | 175 | 175.0 | 175.0 | 175.0 | 212.5 | 250.0 | 250.0 | 250.0 | 250.0 |
## Strings
### Append Tags to Frame
This method extracts tags from a given field and appends them as new columns to the dataframe.
Consider a dataset that looks like this:
``x_train``:
| article_name | article_tags |
|--------------|--------------|
| 1 | ds,ml,dl |
| 2 | ds,ml |
``x_test``:
| article_name | article_tags |
|--------------|--------------|
| 3 | ds,ml,py |
Using this code:
```python
import pandas as pd
from ds_utils.strings import append_tags_to_frame
x_train = pd.DataFrame([{"article_name": "1", "article_tags": "ds,ml,dl"},
{"article_name": "2", "article_tags": "ds,ml"}])
x_test = pd.DataFrame([{"article_name": "3", "article_tags": "ds,ml,py"}])
x_train_with_tags, x_test_with_tags = append_tags_to_frame(x_train, x_test, "article_tags", "tag_")
```
The result will be:
``x_train_with_tags``:
| article_name | tag_ds | tag_ml | tag_dl |
|--------------|--------|--------|--------|
| 1 | 1 | 1 | 1 |
| 2 | 1 | 1 | 0 |
``x_test_with_tags``:
| article_name | tag_ds | tag_ml | tag_dl |
|--------------|--------|--------|--------|
| 3 | 1 | 1 | 0 |
### Extract Significant Terms from Subset
This method returns interesting or unusual occurrences of terms in a subset. It is based on the
[elasticsearch significant_text aggregation](https://www.elastic.co/guide/en/elasticsearch/reference/current/search-aggregations-bucket-significantterms-aggregation.html#_scripted).
```python
import pandas as pd
from ds_utils.strings import extract_significant_terms_from_subset
corpus = ['This is the first document.', 'This document is the second document.',
'And this is the third one.', 'Is this the first document?']
data_frame = pd.DataFrame(corpus, columns=["content"])
# Let's differentiate between the last two documents from the full corpus
subset_data_frame = data_frame[data_frame.index > 1]
terms = extract_significant_terms_from_subset(data_frame, subset_data_frame,
"content")
```
The output for ``terms`` will be the following table:
| third | one | and | this | the | is | first | document | second |
|-------|-----|-----|------|------|------|-------|----------|--------|
| 1.0 | 1.0 | 1.0 | 0.67 | 0.67 | 0.67 | 0.5 | 0.25 | 0.0 |
## Unsupervised
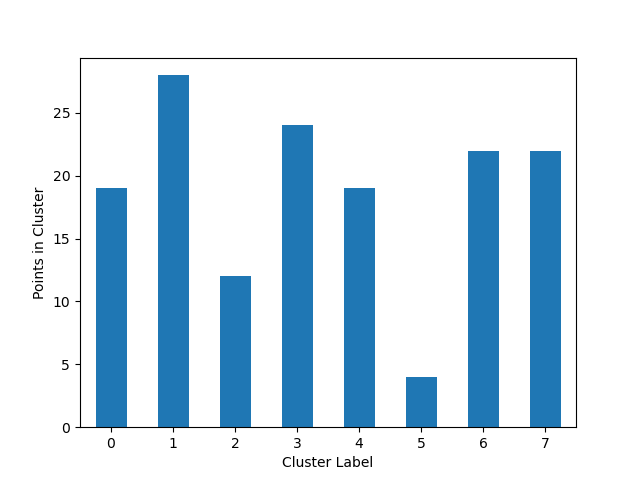
### Cluster Cardinality
Cluster cardinality is the number of examples per cluster. This method plots the number of points per cluster as a bar
chart.
```python
import pandas as pd
from matplotlib import pyplot as plt
from sklearn.cluster import KMeans
from ds_utils.unsupervised import plot_cluster_cardinality
data = pd.read_csv(path / to / dataset)
estimator = KMeans(n_clusters=8, random_state=42)
estimator.fit(data)
plot_cluster_cardinality(estimator.labels_)
plt.show()
```
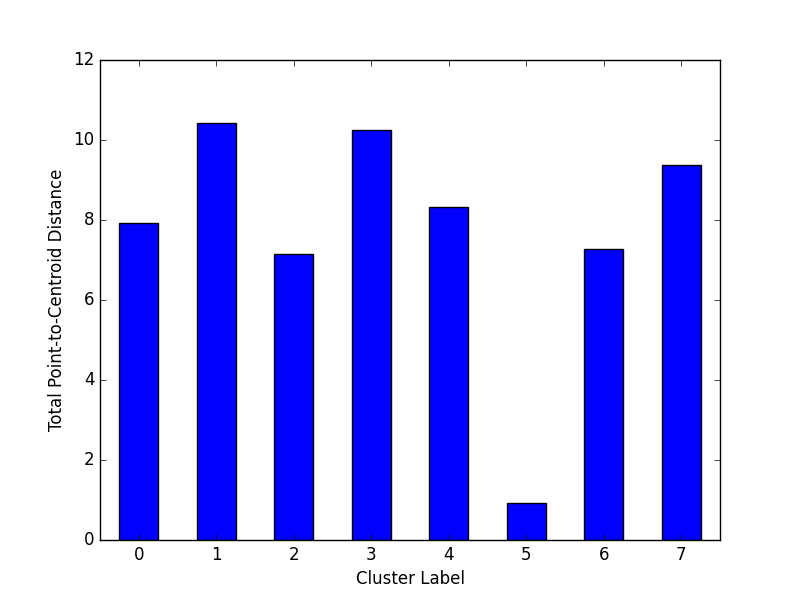
### Plot Cluster Magnitude
Cluster magnitude is the sum of distances from all examples to the centroid of the cluster. This method plots the
Total Point-to-Centroid Distance per cluster as a bar chart.
```python
import pandas as pd
from matplotlib import pyplot as plt
from sklearn.cluster import KMeans
from scipy.spatial.distance import euclidean
from ds_utils.unsupervised import plot_cluster_magnitude
data = pd.read_csv(path / to / dataset)
estimator = KMeans(n_clusters=8, random_state=42)
estimator.fit(data)
plot_cluster_magnitude(data, estimator.labels_, estimator.cluster_centers_, euclidean)
plt.show()
```
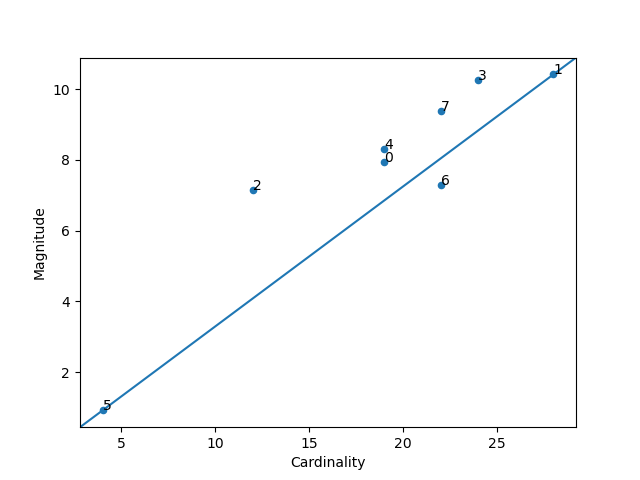
### Magnitude vs. Cardinality
Higher cluster cardinality tends to result in a higher cluster magnitude, which intuitively makes sense. Clusters
are considered anomalous when cardinality doesn't correlate with magnitude relative to the other clusters. This
method helps find anomalous clusters by plotting magnitude against cardinality as a scatter plot.
```python
import pandas as pd
from matplotlib import pyplot as plt
from sklearn.cluster import KMeans
from scipy.spatial.distance import euclidean
from ds_utils.unsupervised import plot_magnitude_vs_cardinality
data = pd.read_csv(path / to / dataset)
estimator = KMeans(n_clusters=8, random_state=42)
estimator.fit(data)
plot_magnitude_vs_cardinality(data, estimator.labels_, estimator.cluster_centers_, euclidean)
plt.show()
```
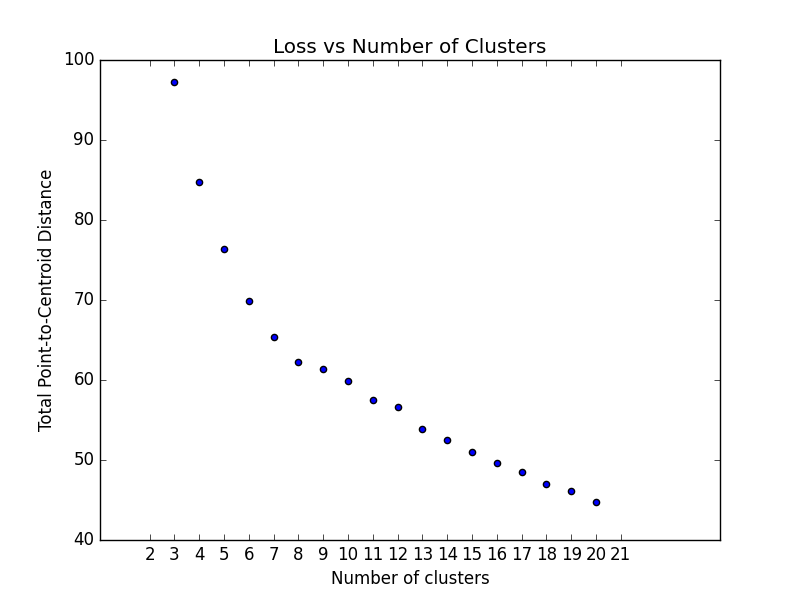
### Optimum Number of Clusters
K-means clustering requires you to decide the number of clusters `k` beforehand. This method runs the KMeans algorithm
and
increases the cluster number at each iteration. The total magnitude or sum of distances is used as the loss metric.
Note: Currently, this method only works with ``sklearn.cluster.KMeans``.
```python
import pandas as pd
from matplotlib import pyplot as plt
from scipy.spatial.distance import euclidean
from ds_utils.unsupervised import plot_loss_vs_cluster_number
data = pd.read_csv(path / to / dataset)
plot_loss_vs_cluster_number(data, 3, 20, euclidean)
plt.show()
```
## XAI (Explainable AI)
## Plot Feature Importance
This method plots feature importance as a bar chart, helping to visualize which features have the most significant
impact on the model's decisions.
```python
import pandas as pd
from matplotlib import pyplot as plt
from sklearn.tree import DecisionTreeClassifier
from ds_utils.xai import plot_features_importance
# Load the dataset
data = pd.read_csv(path / to / dataset)
target = data["target"]
features = data.columns.tolist()
features.remove("target")
# Train a decision tree classifier
clf = DecisionTreeClassifier(random_state=42)
clf.fit(data[features], target)
# Plot feature importance
plot_features_importance(features, clf.feature_importances_)
plt.show()
```
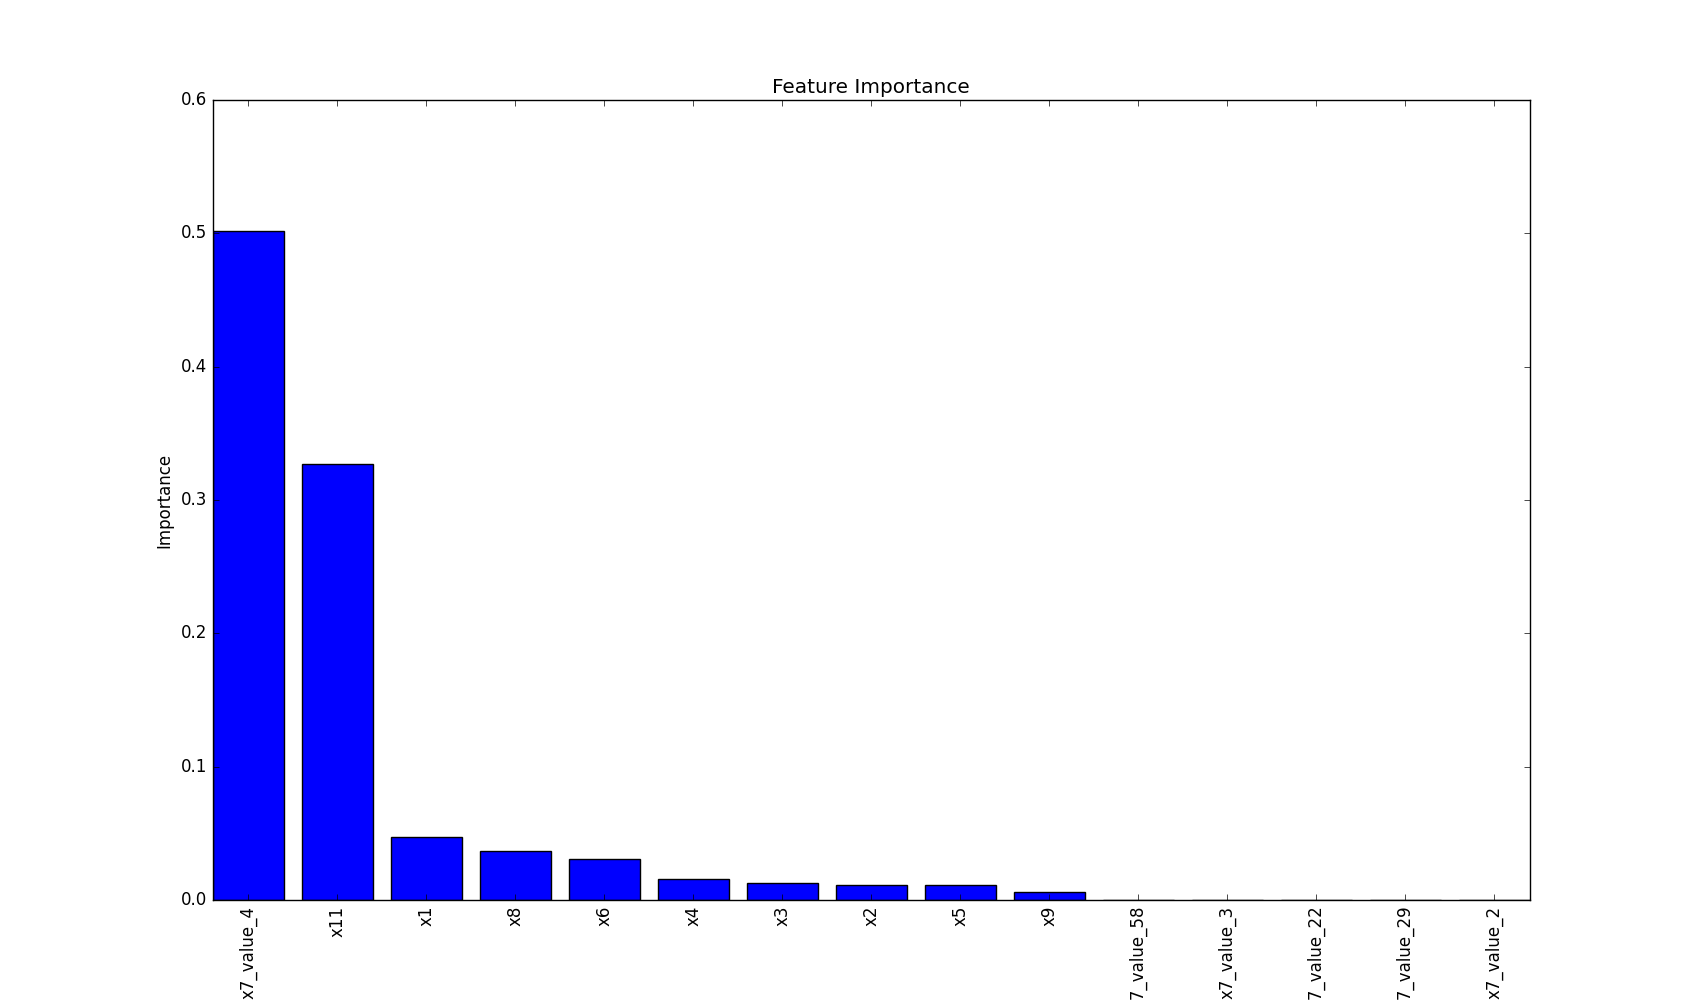
This visualization helps in understanding which features are most influential in the model's decision-making process,
providing valuable insights for feature selection and model interpretation.
## Explore More
Excited about what you've seen so far? There's even more to discover! Dive deeper into each module to unlock the full
potential of DataScienceUtils:
* [Metrics](https://datascienceutils.readthedocs.io/en/latest/metrics.html) - Powerful methods for calculating and
visualizing algorithm performance evaluation. Gain insights into how your models are performing.
* [Preprocess](https://datascienceutils.readthedocs.io/en/latest/preprocess.html) - Essential data preprocessing
techniques to prepare your data for training. Improve your model's input for better results.
* [Strings](https://datascienceutils.readthedocs.io/en/latest/strings.html) - Efficient methods for manipulating and
processing strings in dataframes. Handle text data with ease.
* [Unsupervised](https://datascienceutils.readthedocs.io/en/latest/unsupervised.html) - Tools for calculating and
visualizing the performance of unsupervised models. Understand your clustering and dimensionality reduction results
better.
* [XAI](https://datascienceutils.readthedocs.io/en/latest/xai.html) - Methods to help explain model decisions, making
your AI more interpretable and trustworthy.
Each module is designed to streamline your data science workflow, providing you with the tools you need to preprocess
data, train models, evaluate performance, and interpret results. Check out the detailed documentation for each module to
see how DataScienceUtils can enhance your projects!
## Contributing
We're thrilled that you're interested in contributing to Data Science Utils! Your contributions help make this project
better for everyone. Whether you're a seasoned developer or just getting started, there's a place for you here.
### How to Contribute
1. **Find an area to contribute to**: Check out our [issues](https://github.com/idanmoradarthas/DataScienceUtils/issues)
page for open tasks, or think of a feature you'd like to add.
2. **Fork the repository**: Make your own copy of the project to work on.
3. **Create a branch**: Make your changes in a new git branch.
4. **Make your changes**: Add your improvements or fixes. We appreciate:
- Bug reports and fixes
- Feature requests and implementations
- Documentation improvements
- Performance optimizations
- User experience enhancements
5. **Test your changes**: Ensure your code works as expected and doesn't introduce new issues.
6. **Submit a pull request**: Open a PR with a clear title and description of your changes.
### Coding Guidelines
We follow the [Python Software Foundation Code of Conduct](http://www.python.org/psf/codeofconduct/) and
the [Matplotlib Usage Guide](https://matplotlib.org/tutorials/introductory/usage.html#coding-styles). Please adhere to
these guidelines in your contributions.
### Getting Help
If you're new to open source or need any help, don't hesitate to ask questions in
the [issues](https://github.com/idanmoradarthas/DataScienceUtils/issues) section or reach out to the
maintainers. We're here to help!
### Why Contribute?
- **Improve your skills**: Gain experience working on a real-world project.
- **Be part of a community**: Connect with other developers and data scientists.
- **Make a difference**: Your contributions will help others in their data science journey.
- **Get recognition**: All contributors are acknowledged in our project.
Remember, no contribution is too small. Whether it's fixing a typo in documentation or adding a major feature, all
contributions are valued and appreciated.
Thank you for helping make Data Science Utils better for everyone!
## Installation Guide
Here are several ways to install the package:
### 1. Install from PyPI (Recommended)
The simplest way to install Data Science Utils and its dependencies is from PyPI using pip, Python's preferred package
installer:
```bash
pip install data-science-utils
```
To upgrade Data Science Utils to the latest version, use:
```bash
pip install -U data-science-utils
```
### 2. Install from Source
If you prefer to install from source, you can clone the repository and install:
```bash
git clone https://github.com/idanmoradarthas/DataScienceUtils.git
cd DataScienceUtils
pip install .
```
Alternatively, you can install directly from GitHub using pip:
```bash
pip install git+https://github.com/idanmoradarthas/DataScienceUtils.git
```
### 3. Install using Anaconda
If you're using Anaconda, you can install using conda:
```bash
conda install idanmorad::data-science-utils
```
### Note on Dependencies
Data Science Utils has several dependencies, including numpy, pandas, matplotlib, plotly and scikit-learn. These will be
automatically installed when you install the package using the methods above.
## Staying Updated
Data Science Utils is an active project that routinely publishes new releases with additional methods and improvements.
We recommend periodically checking for updates to access the latest features and bug fixes.
If you encounter any issues during installation, please check our
GitHub [issues](https://github.com/idanmoradarthas/DataScienceUtils/issues) page or open a new issue for assistance.
Raw data
{
"_id": null,
"home_page": null,
"name": "data-science-utils",
"maintainer": null,
"docs_url": null,
"requires_python": ">=3.9",
"maintainer_email": null,
"keywords": "data-science, utilities, python, machine-learning, scikit-learn, matplotlib, plotly",
"author": null,
"author_email": "Idan Morad <idanmorad.arthas@gmail.com>",
"download_url": "https://files.pythonhosted.org/packages/22/87/a8a8b1081e30940c171df7d63082503728e14ed49c171955f7485287e863/data_science_utils-1.8.1.tar.gz",
"platform": null,
"description": "# Data Science Utils: Frequently Used Methods for Data Science\r\n\r\n[](https://opensource.org/licenses/MIT)\r\n\r\n[](https://github.com/idanmoradarthas/DataScienceUtils/issues)\r\n[](https://datascienceutils.readthedocs.io/en/latest/?badge=latest)\r\n\r\n\r\n[](https://badge.fury.io/py/data-science-utils)\r\n[](https://anaconda.org/idanmorad/data-science-utils)\r\n\r\n[](https://coveralls.io/github/idanmoradarthas/DataScienceUtils?branch=master)\r\n\r\nData Science Utils extends the Scikit-Learn API and Matplotlib API to provide simple methods that simplify tasks and\r\nvisualizations for data science projects.\r\n\r\n# Code Examples and Documentation\r\n\r\n**Let's explore some code examples and outputs.**\r\n\r\n**You can find the full documentation with all the code examples at:\r\n[https://datascienceutils.readthedocs.io/en/stable/](https://datascienceutils.readthedocs.io/en/stable/)**\r\n\r\nIn the documentation, you can find more methods and additional examples.\r\n\r\nThe API of the package is built to work with the Scikit-Learn API and Matplotlib API. Here are some of the capabilities\r\nof this\r\npackage:\r\n\r\n## Metrics\r\n\r\n### Plot Confusion Matrix\r\n\r\nComputes and plots a confusion matrix, False Positive Rate, False Negative Rate, Accuracy, and F1 score of a\r\nclassification.\r\n\r\n```python\r\nfrom ds_utils.metrics import plot_confusion_matrix\r\n\r\nplot_confusion_matrix(y_test, y_pred, [0, 1, 2])\r\n```\r\n\r\n\r\n\r\n### Plot Metric Growth per Labeled Instances\r\n\r\nReceives train and test sets, and plots the given metric change with an increasing number of trained instances.\r\n\r\n```python\r\nfrom ds_utils.metrics import plot_metric_growth_per_labeled_instances\r\nfrom sklearn.tree import DecisionTreeClassifier\r\nfrom sklearn.ensemble import RandomForestClassifier\r\n\r\nplot_metric_growth_per_labeled_instances(\r\n x_train, y_train, x_test, y_test,\r\n {\r\n \"DecisionTreeClassifier\": DecisionTreeClassifier(random_state=0),\r\n \"RandomForestClassifier\": RandomForestClassifier(random_state=0, n_estimators=5)\r\n }\r\n)\r\n```\r\n\r\n\r\n\r\n### Visualize Accuracy Grouped by Probability\r\n\r\nReceives test true labels and classifier probability predictions, divides and classifies the results, and finally\r\nplots a stacked bar chart with the results. [Original code](https://github.com/EthicalML/XAI)\r\n\r\n```python\r\nfrom ds_utils.metrics import visualize_accuracy_grouped_by_probability\r\n\r\nvisualize_accuracy_grouped_by_probability(\r\n test[\"target\"],\r\n 1,\r\n classifier.predict_proba(test[selected_features]),\r\n display_breakdown=False\r\n)\r\n```\r\n\r\nWithout breakdown:\r\n\r\n\r\n\r\nWith breakdown:\r\n\r\n\r\n\r\n### Receiver Operating Characteristic (ROC) Curve with Probabilities (Thresholds) Annotations\r\n\r\nPlot ROC curves with threshold annotations for multiple classifiers, using plotly as a backend.\r\n\r\n```python\r\nfrom ds_utils.metrics import plot_roc_curve_with_thresholds_annotations\r\n\r\nclassifiers_names_and_scores_dict = {\r\n \"Decision Tree\": tree_clf.predict_proba(X_test)[:, 1],\r\n \"Random Forest\": rf_clf.predict_proba(X_test)[:, 1],\r\n \"XGBoost\": xgb_clf.predict_proba(X_test)[:, 1]\r\n}\r\nfig = plot_roc_curve_with_thresholds_annotations(\r\n y_true,\r\n classifiers_names_and_scores_dict,\r\n positive_label=1\r\n)\r\nfig.show()\r\n```\r\n\r\n\r\n\r\n### Precision-Recall Curve with Probabilities (Thresholds) Annotations\r\n\r\nPlot Precision-Recall curves with threshold annotations for multiple classifiers, using plotly as a backend.\r\n\r\n```python\r\nfrom ds_utils.metrics import plot_precision_recall_curve_with_thresholds_annotations\r\n\r\nclassifiers_names_and_scores_dict = {\r\n \"Decision Tree\": tree_clf.predict_proba(X_test)[:, 1],\r\n \"Random Forest\": rf_clf.predict_proba(X_test)[:, 1],\r\n \"XGBoost\": xgb_clf.predict_proba(X_test)[:, 1]\r\n}\r\nfig = plot_precision_recall_curve_with_thresholds_annotations(\r\n y_true,\r\n classifiers_names_and_scores_dict,\r\n positive_label=1\r\n)\r\nfig.show()\r\n```\r\n\r\n\r\n\r\n## Preprocess\r\n\r\n### Visualize Feature\r\n\r\nReceives a feature and visualizes its values on a graph:\r\n\r\n* If the feature is float, the method plots the distribution plot.\r\n* If the feature is datetime, the method plots a line plot of progression over time.\r\n* If the feature is object, categorical, boolean, or integer, the method plots a count plot (histogram).\r\n\r\n```python\r\nfrom ds_utils.preprocess import visualize_feature\r\n\r\nvisualize_feature(X_train[\"feature\"])\r\n```\r\n\r\n| Feature Type | Plot |\r\n|-------------------|----------------------------------------------------------------------------------------------------------------------------------------------------------------------------------|\r\n| Float |  |\r\n| Integer |  |\r\n| Datetime |  |\r\n| Category / Object |  |\r\n| Boolean |  |\r\n\r\n### Get Correlated Features\r\n\r\nCalculate which features are correlated above a threshold and extract a data frame with the correlations and correlation\r\nto the target feature.\r\n\r\n```python\r\nfrom ds_utils.preprocess import get_correlated_features\r\n\r\ncorrelations = get_correlated_features(correlation_matrix, features, target)\r\n```\r\n\r\n| level_0 | level_1 | level_0_level_1_corr | level_0_target_corr | level_1_target_corr |\r\n|------------------------|------------------------|----------------------|---------------------|---------------------|\r\n| income_category_Low | income_category_Medium | 1.0 | 0.1182165609358650 | 0.11821656093586504 |\r\n| term\\_ 36 months | term\\_ 60 months | 1.0 | 0.1182165609358650 | 0.11821656093586504 |\r\n| interest_payments_High | interest_payments_Low | 1.0 | 0.1182165609358650 | 0.11821656093586504 |\r\n\r\n### Visualize Correlations\r\n\r\nCompute pairwise correlation of columns, excluding NA/null values, and visualize it with a heat map.\r\n[Original code](https://seaborn.pydata.org/examples/many_pairwise_correlations.html)\r\n\r\n```python\r\nfrom ds_utils.preprocess import visualize_correlations\r\n\r\nvisualize_correlations(correlation_matrix)\r\n```\r\n\r\n\r\n\r\n### Plot Correlation Dendrogram\r\n\r\nPlot a dendrogram of a correlation matrix. This consists of a chart that shows hierarchically the variables that are\r\nmost correlated by connecting trees. The closer to the right that the connection is, the more correlated the\r\nfeatures are. [Original code](https://github.com/EthicalML/XAI)\r\n\r\n```python\r\nfrom ds_utils.preprocess import plot_correlation_dendrogram\r\n\r\nplot_correlation_dendrogram(correlation_matrix)\r\n```\r\n\r\n\r\n\r\n### Plot Features' Interaction\r\n\r\nPlots the joint distribution between two features:\r\n\r\n* If both features are either categorical, boolean, or object, the method plots the shared histogram.\r\n* If one feature is either categorical, boolean, or object and the other is numeric, the method plots a boxplot chart.\r\n* If one feature is datetime and the other is numeric or datetime, the method plots a line plot graph.\r\n* If one feature is datetime and the other is either categorical, boolean, or object, the method plots a violin plot (\r\n combination of boxplot and kernel density estimate).\r\n* If both features are numeric, the method plots a scatter graph.\r\n\r\n```python\r\nfrom ds_utils.preprocess import plot_features_interaction\r\n\r\nplot_features_interaction(data, \"feature_1\", \"feature_2\")\r\n```\r\n\r\n| | Numeric | Categorical | Boolean | Datetime |\r\n|-----------------|--------------------------------------------------------------------------------------------------------------------------------------------------------------------------------------|---------------------------------------------------------------------------------------------------------------------------------------------------------------------------------------|----------------------------------------------------------------------------------------------------------------------------------------------------------------------------------------|------------------------------------------------------------------------------------------------------------------------------------------------------------------------------------|\r\n| **Numeric** |  | | | |\r\n| **Categorical** |  |  | | |\r\n| **Boolean** |  |  |  | |\r\n| **Datetime** |  |  |  |  |\r\n\r\n### Extract Statistics DataFrame per Label\r\n\r\nThis method calculates comprehensive statistical metrics for numerical features grouped by label values. Use this when\r\nyou want to:\r\n\r\n- Analyze how a numerical feature's distribution varies across different categories\r\n- Detect potential patterns or anomalies in feature behavior per group\r\n- Generate detailed statistical summaries for reporting or analysis\r\n- Understand the relationship between features and target variables\r\n\r\n```python\r\nfrom ds_utils.preprocess import extract_statistics_dataframe_per_label\r\n\r\nextract_statistics_dataframe_per_label(\r\n df=df,\r\n feature_name='amount',\r\n label_name='category'\r\n)\r\n```\r\n\r\n| category | count | null_count | mean | min | 1_percentile | 5_percentile | 25_percentile | median | 75_percentile | 95_percentile | 99_percentile | max |\r\n|----------|-------|------------|-------|-----|--------------|--------------|---------------|--------|---------------|---------------|---------------|-------|\r\n| A | 2 | 0 | 150.0 | 100 | 100.0 | 100.0 | 100.0 | 150.0 | 200.0 | 200.0 | 200.0 | 200.0 |\r\n| B | 2 | 0 | 225.0 | 150 | 150.0 | 150.0 | 150.0 | 225.0 | 300.0 | 300.0 | 300.0 | 300.0 |\r\n| C | 2 | 0 | 212.5 | 175 | 175.0 | 175.0 | 175.0 | 212.5 | 250.0 | 250.0 | 250.0 | 250.0 |\r\n\r\n## Strings\r\n\r\n### Append Tags to Frame\r\n\r\nThis method extracts tags from a given field and appends them as new columns to the dataframe.\r\n\r\nConsider a dataset that looks like this:\r\n\r\n``x_train``:\r\n\r\n| article_name | article_tags |\r\n|--------------|--------------|\r\n| 1 | ds,ml,dl |\r\n| 2 | ds,ml |\r\n\r\n``x_test``:\r\n\r\n| article_name | article_tags |\r\n|--------------|--------------|\r\n| 3 | ds,ml,py |\r\n\r\nUsing this code:\r\n\r\n```python\r\nimport pandas as pd\r\nfrom ds_utils.strings import append_tags_to_frame\r\n\r\nx_train = pd.DataFrame([{\"article_name\": \"1\", \"article_tags\": \"ds,ml,dl\"},\r\n {\"article_name\": \"2\", \"article_tags\": \"ds,ml\"}])\r\nx_test = pd.DataFrame([{\"article_name\": \"3\", \"article_tags\": \"ds,ml,py\"}])\r\n\r\nx_train_with_tags, x_test_with_tags = append_tags_to_frame(x_train, x_test, \"article_tags\", \"tag_\")\r\n```\r\n\r\nThe result will be:\r\n\r\n``x_train_with_tags``:\r\n\r\n| article_name | tag_ds | tag_ml | tag_dl |\r\n|--------------|--------|--------|--------|\r\n| 1 | 1 | 1 | 1 |\r\n| 2 | 1 | 1 | 0 |\r\n\r\n``x_test_with_tags``:\r\n\r\n| article_name | tag_ds | tag_ml | tag_dl |\r\n|--------------|--------|--------|--------|\r\n| 3 | 1 | 1 | 0 |\r\n\r\n### Extract Significant Terms from Subset\r\n\r\nThis method returns interesting or unusual occurrences of terms in a subset. It is based on the\r\n[elasticsearch significant_text aggregation](https://www.elastic.co/guide/en/elasticsearch/reference/current/search-aggregations-bucket-significantterms-aggregation.html#_scripted).\r\n\r\n```python\r\nimport pandas as pd\r\nfrom ds_utils.strings import extract_significant_terms_from_subset\r\n\r\ncorpus = ['This is the first document.', 'This document is the second document.',\r\n 'And this is the third one.', 'Is this the first document?']\r\ndata_frame = pd.DataFrame(corpus, columns=[\"content\"])\r\n# Let's differentiate between the last two documents from the full corpus\r\nsubset_data_frame = data_frame[data_frame.index > 1]\r\nterms = extract_significant_terms_from_subset(data_frame, subset_data_frame,\r\n \"content\")\r\n```\r\n\r\nThe output for ``terms`` will be the following table:\r\n\r\n| third | one | and | this | the | is | first | document | second |\r\n|-------|-----|-----|------|------|------|-------|----------|--------|\r\n| 1.0 | 1.0 | 1.0 | 0.67 | 0.67 | 0.67 | 0.5 | 0.25 | 0.0 |\r\n\r\n## Unsupervised\r\n\r\n### Cluster Cardinality\r\n\r\nCluster cardinality is the number of examples per cluster. This method plots the number of points per cluster as a bar\r\nchart.\r\n\r\n```python\r\nimport pandas as pd\r\nfrom matplotlib import pyplot as plt\r\nfrom sklearn.cluster import KMeans\r\nfrom ds_utils.unsupervised import plot_cluster_cardinality\r\n\r\ndata = pd.read_csv(path / to / dataset)\r\nestimator = KMeans(n_clusters=8, random_state=42)\r\nestimator.fit(data)\r\n\r\nplot_cluster_cardinality(estimator.labels_)\r\n\r\nplt.show()\r\n```\r\n\r\n\r\n\r\n### Plot Cluster Magnitude\r\n\r\nCluster magnitude is the sum of distances from all examples to the centroid of the cluster. This method plots the\r\nTotal Point-to-Centroid Distance per cluster as a bar chart.\r\n\r\n```python\r\nimport pandas as pd\r\nfrom matplotlib import pyplot as plt\r\nfrom sklearn.cluster import KMeans\r\nfrom scipy.spatial.distance import euclidean\r\nfrom ds_utils.unsupervised import plot_cluster_magnitude\r\n\r\ndata = pd.read_csv(path / to / dataset)\r\nestimator = KMeans(n_clusters=8, random_state=42)\r\nestimator.fit(data)\r\n\r\nplot_cluster_magnitude(data, estimator.labels_, estimator.cluster_centers_, euclidean)\r\n\r\nplt.show()\r\n```\r\n\r\n\r\n\r\n### Magnitude vs. Cardinality\r\n\r\nHigher cluster cardinality tends to result in a higher cluster magnitude, which intuitively makes sense. Clusters\r\nare considered anomalous when cardinality doesn't correlate with magnitude relative to the other clusters. This\r\nmethod helps find anomalous clusters by plotting magnitude against cardinality as a scatter plot.\r\n\r\n```python\r\nimport pandas as pd\r\nfrom matplotlib import pyplot as plt\r\nfrom sklearn.cluster import KMeans\r\nfrom scipy.spatial.distance import euclidean\r\nfrom ds_utils.unsupervised import plot_magnitude_vs_cardinality\r\n\r\ndata = pd.read_csv(path / to / dataset)\r\nestimator = KMeans(n_clusters=8, random_state=42)\r\nestimator.fit(data)\r\n\r\nplot_magnitude_vs_cardinality(data, estimator.labels_, estimator.cluster_centers_, euclidean)\r\n\r\nplt.show()\r\n```\r\n\r\n\r\n\r\n### Optimum Number of Clusters\r\n\r\nK-means clustering requires you to decide the number of clusters `k` beforehand. This method runs the KMeans algorithm\r\nand\r\nincreases the cluster number at each iteration. The total magnitude or sum of distances is used as the loss metric.\r\n\r\nNote: Currently, this method only works with ``sklearn.cluster.KMeans``.\r\n\r\n```python\r\nimport pandas as pd\r\nfrom matplotlib import pyplot as plt\r\nfrom scipy.spatial.distance import euclidean\r\nfrom ds_utils.unsupervised import plot_loss_vs_cluster_number\r\n\r\ndata = pd.read_csv(path / to / dataset)\r\n\r\nplot_loss_vs_cluster_number(data, 3, 20, euclidean)\r\n\r\nplt.show()\r\n```\r\n\r\n\r\n\r\n## XAI (Explainable AI)\r\n\r\n## Plot Feature Importance\r\n\r\nThis method plots feature importance as a bar chart, helping to visualize which features have the most significant\r\nimpact on the model's decisions.\r\n\r\n```python\r\nimport pandas as pd\r\nfrom matplotlib import pyplot as plt\r\nfrom sklearn.tree import DecisionTreeClassifier\r\nfrom ds_utils.xai import plot_features_importance\r\n\r\n# Load the dataset\r\ndata = pd.read_csv(path / to / dataset)\r\ntarget = data[\"target\"]\r\nfeatures = data.columns.tolist()\r\nfeatures.remove(\"target\")\r\n\r\n# Train a decision tree classifier\r\nclf = DecisionTreeClassifier(random_state=42)\r\nclf.fit(data[features], target)\r\n\r\n# Plot feature importance\r\nplot_features_importance(features, clf.feature_importances_)\r\n\r\nplt.show()\r\n```\r\n\r\n\r\n\r\nThis visualization helps in understanding which features are most influential in the model's decision-making process,\r\nproviding valuable insights for feature selection and model interpretation.\r\n\r\n## Explore More\r\n\r\nExcited about what you've seen so far? There's even more to discover! Dive deeper into each module to unlock the full\r\npotential of DataScienceUtils:\r\n\r\n* [Metrics](https://datascienceutils.readthedocs.io/en/latest/metrics.html) - Powerful methods for calculating and\r\n visualizing algorithm performance evaluation. Gain insights into how your models are performing.\r\n\r\n* [Preprocess](https://datascienceutils.readthedocs.io/en/latest/preprocess.html) - Essential data preprocessing\r\n techniques to prepare your data for training. Improve your model's input for better results.\r\n\r\n* [Strings](https://datascienceutils.readthedocs.io/en/latest/strings.html) - Efficient methods for manipulating and\r\n processing strings in dataframes. Handle text data with ease.\r\n\r\n* [Unsupervised](https://datascienceutils.readthedocs.io/en/latest/unsupervised.html) - Tools for calculating and\r\n visualizing the performance of unsupervised models. Understand your clustering and dimensionality reduction results\r\n better.\r\n\r\n* [XAI](https://datascienceutils.readthedocs.io/en/latest/xai.html) - Methods to help explain model decisions, making\r\n your AI more interpretable and trustworthy.\r\n\r\nEach module is designed to streamline your data science workflow, providing you with the tools you need to preprocess\r\ndata, train models, evaluate performance, and interpret results. Check out the detailed documentation for each module to\r\nsee how DataScienceUtils can enhance your projects!\r\n\r\n## Contributing\r\n\r\nWe're thrilled that you're interested in contributing to Data Science Utils! Your contributions help make this project\r\nbetter for everyone. Whether you're a seasoned developer or just getting started, there's a place for you here.\r\n\r\n### How to Contribute\r\n\r\n1. **Find an area to contribute to**: Check out our [issues](https://github.com/idanmoradarthas/DataScienceUtils/issues)\r\n page for open tasks, or think of a feature you'd like to add.\r\n\r\n2. **Fork the repository**: Make your own copy of the project to work on.\r\n\r\n3. **Create a branch**: Make your changes in a new git branch.\r\n\r\n4. **Make your changes**: Add your improvements or fixes. We appreciate:\r\n - Bug reports and fixes\r\n - Feature requests and implementations\r\n - Documentation improvements\r\n - Performance optimizations\r\n - User experience enhancements\r\n\r\n5. **Test your changes**: Ensure your code works as expected and doesn't introduce new issues.\r\n\r\n6. **Submit a pull request**: Open a PR with a clear title and description of your changes.\r\n\r\n### Coding Guidelines\r\n\r\nWe follow the [Python Software Foundation Code of Conduct](http://www.python.org/psf/codeofconduct/) and\r\nthe [Matplotlib Usage Guide](https://matplotlib.org/tutorials/introductory/usage.html#coding-styles). Please adhere to\r\nthese guidelines in your contributions.\r\n\r\n### Getting Help\r\n\r\nIf you're new to open source or need any help, don't hesitate to ask questions in\r\nthe [issues](https://github.com/idanmoradarthas/DataScienceUtils/issues) section or reach out to the\r\nmaintainers. We're here to help!\r\n\r\n### Why Contribute?\r\n\r\n- **Improve your skills**: Gain experience working on a real-world project.\r\n- **Be part of a community**: Connect with other developers and data scientists.\r\n- **Make a difference**: Your contributions will help others in their data science journey.\r\n- **Get recognition**: All contributors are acknowledged in our project.\r\n\r\nRemember, no contribution is too small. Whether it's fixing a typo in documentation or adding a major feature, all\r\ncontributions are valued and appreciated.\r\n\r\nThank you for helping make Data Science Utils better for everyone!\r\n\r\n## Installation Guide\r\n\r\nHere are several ways to install the package:\r\n\r\n### 1. Install from PyPI (Recommended)\r\n\r\nThe simplest way to install Data Science Utils and its dependencies is from PyPI using pip, Python's preferred package\r\ninstaller:\r\n\r\n```bash\r\npip install data-science-utils\r\n```\r\n\r\nTo upgrade Data Science Utils to the latest version, use:\r\n\r\n```bash\r\npip install -U data-science-utils\r\n```\r\n\r\n### 2. Install from Source\r\n\r\nIf you prefer to install from source, you can clone the repository and install:\r\n\r\n```bash\r\ngit clone https://github.com/idanmoradarthas/DataScienceUtils.git\r\ncd DataScienceUtils\r\npip install .\r\n```\r\n\r\nAlternatively, you can install directly from GitHub using pip:\r\n\r\n```bash\r\npip install git+https://github.com/idanmoradarthas/DataScienceUtils.git\r\n```\r\n\r\n### 3. Install using Anaconda\r\n\r\nIf you're using Anaconda, you can install using conda:\r\n\r\n```bash\r\nconda install idanmorad::data-science-utils\r\n```\r\n\r\n### Note on Dependencies\r\n\r\nData Science Utils has several dependencies, including numpy, pandas, matplotlib, plotly and scikit-learn. These will be\r\nautomatically installed when you install the package using the methods above.\r\n\r\n## Staying Updated\r\n\r\nData Science Utils is an active project that routinely publishes new releases with additional methods and improvements.\r\nWe recommend periodically checking for updates to access the latest features and bug fixes.\r\n\r\nIf you encounter any issues during installation, please check our\r\nGitHub [issues](https://github.com/idanmoradarthas/DataScienceUtils/issues) page or open a new issue for assistance.\r\n",
"bugtrack_url": null,
"license": "MIT",
"summary": "Data Science Utils extends the Scikit-Learn API and Matplotlib API to provide simple methods that simplify tasks and visualizations for data science projects.",
"version": "1.8.1",
"project_urls": {
"Changelog": "https://github.com/idanmoradarthas/DataScienceUtils/blob/master/CHANGELOG.md",
"Documentation": "https://datascienceutils.readthedocs.io/en/latest/",
"Homepage": "https://github.com/idanmoradarthas/DataScienceUtils",
"Issues": "https://github.com/idanmoradarthas/DataScienceUtils/issues",
"Repository": "https://github.com/idanmoradarthas/DataScienceUtils.git"
},
"split_keywords": [
"data-science",
" utilities",
" python",
" machine-learning",
" scikit-learn",
" matplotlib",
" plotly"
],
"urls": [
{
"comment_text": "",
"digests": {
"blake2b_256": "32a44d523e05a8cc25e1698611092d62de5a285aff90ecc21657440cb5436022",
"md5": "1faa1a9b5001a9aaf56c7b89b92db721",
"sha256": "6d36e6f8984d99d75fd2e38f31b7d59439d208cab92575847b13b2139ad4c8d5"
},
"downloads": -1,
"filename": "data_science_utils-1.8.1-py3-none-any.whl",
"has_sig": false,
"md5_digest": "1faa1a9b5001a9aaf56c7b89b92db721",
"packagetype": "bdist_wheel",
"python_version": "py3",
"requires_python": ">=3.9",
"size": 26265,
"upload_time": "2025-01-28T19:31:38",
"upload_time_iso_8601": "2025-01-28T19:31:38.561496Z",
"url": "https://files.pythonhosted.org/packages/32/a4/4d523e05a8cc25e1698611092d62de5a285aff90ecc21657440cb5436022/data_science_utils-1.8.1-py3-none-any.whl",
"yanked": false,
"yanked_reason": null
},
{
"comment_text": "",
"digests": {
"blake2b_256": "2287a8a8b1081e30940c171df7d63082503728e14ed49c171955f7485287e863",
"md5": "9fe752baa6ed16630bfdd9df9885ccce",
"sha256": "dae94a834209904341ac78365262630f5e4264615ffbe951c8f6b88407e1e2c8"
},
"downloads": -1,
"filename": "data_science_utils-1.8.1.tar.gz",
"has_sig": false,
"md5_digest": "9fe752baa6ed16630bfdd9df9885ccce",
"packagetype": "sdist",
"python_version": "source",
"requires_python": ">=3.9",
"size": 43043,
"upload_time": "2025-01-28T19:31:41",
"upload_time_iso_8601": "2025-01-28T19:31:41.621085Z",
"url": "https://files.pythonhosted.org/packages/22/87/a8a8b1081e30940c171df7d63082503728e14ed49c171955f7485287e863/data_science_utils-1.8.1.tar.gz",
"yanked": false,
"yanked_reason": null
}
],
"upload_time": "2025-01-28 19:31:41",
"github": true,
"gitlab": false,
"bitbucket": false,
"codeberg": false,
"github_user": "idanmoradarthas",
"github_project": "DataScienceUtils",
"travis_ci": false,
"coveralls": true,
"github_actions": true,
"requirements": [
{
"name": "numpy",
"specs": [
[
">=",
"1.26.3"
]
]
},
{
"name": "scipy",
"specs": [
[
">=",
"1.11.4"
]
]
},
{
"name": "pandas",
"specs": [
[
">=",
"2.1.4"
]
]
},
{
"name": "matplotlib",
"specs": [
[
">=",
"3.8.4"
]
]
},
{
"name": "seaborn",
"specs": [
[
">=",
"0.12.2"
]
]
},
{
"name": "scikit-learn",
"specs": [
[
">=",
"1.2.2"
]
]
},
{
"name": "pydotplus",
"specs": [
[
">=",
"2.0.2"
]
]
},
{
"name": "joblib",
"specs": [
[
">=",
"1.2.0"
]
]
},
{
"name": "plotly",
"specs": [
[
">=",
"5.24.1"
]
]
}
],
"tox": true,
"lcname": "data-science-utils"
}


